
MDbrief
December 2023

MDbrief
December 2023
MDbrief
December 2023
MDbrief
December 2023
A feedback tool for Advanced Cardiac Life Support virtual reality training provides real-time analytics and personalized insights, enabling medical professionals to quickly improve their skills and decision-making through immediate, constructive feedback and progress tracking.
A feedback tool for Advanced Cardiac Life Support virtual reality training provides real-time analytics and personalized insights, enabling medical professionals to quickly improve their skills and decision-making through immediate, constructive feedback and progress tracking.
A feedback tool for Advanced Cardiac Life Support virtual reality training provides real-time analytics and personalized insights, enabling medical professionals to quickly improve their skills and decision-making through immediate, constructive feedback and progress tracking.
A feedback tool for Advanced Cardiac Life Support virtual reality training provides real-time analytics and personalized insights, enabling medical professionals to quickly improve their skills and decision-making through immediate, constructive feedback and progress tracking.
My Role
Product Designer
My Role
Product Designer
My Role
Product Designer
My Role
Product Designer
Project
Client-based
Project
Client-based
Project
Client-based
Project
Client-based
Duration
3 Months
Duration
3 Months
Duration
3 Months
Duration
3 Months
Team
4 UX Designers
Team
4 UX Designers
Team
4 UX Designers
Team
4 UX Designers
Tools Used
Figma
Tools Used
Figma
Tools Used
Figma
Tools Used
Figma
Overview
Prompt
A feedback tool for Advanced Cardiac Life Support virtual reality training provides real-time analytics and personalized insights, enabling medical professionals to quickly improve their skills and decision-making through immediate, constructive feedback and progress tracking.
Overview
Prompt
A feedback tool for Advanced Cardiac Life Support virtual reality training provides real-time analytics and personalized insights, enabling medical professionals to quickly improve their skills and decision-making through immediate, constructive feedback and progress tracking.
Overview
Prompt
A feedback tool for Advanced Cardiac Life Support virtual reality training provides real-time analytics and personalized insights, enabling medical professionals to quickly improve their skills and decision-making through immediate, constructive feedback and progress tracking.
Overview
Prompt
A feedback tool for Advanced Cardiac Life Support virtual reality training provides real-time analytics and personalized insights, enabling medical professionals to quickly improve their skills and decision-making through immediate, constructive feedback and progress tracking.


User Research
User Interviews
Revealed gaps in the ACLS training experience, particularly concerning feedback fidelity and participant stress levels.
Emphasized the need for better feedback mechanisms and more realistic training scenarios to refine the tool and training process.
Impact of different training environments on learning outcomes.
5 Participants
Instructors, students, and other relevant personnel.
5 Participants
Instructors, students, and other relevant personnel.
5 Participants
Instructors, students, and other relevant personnel.
5 Participants
Instructors, students, and other relevant personnel
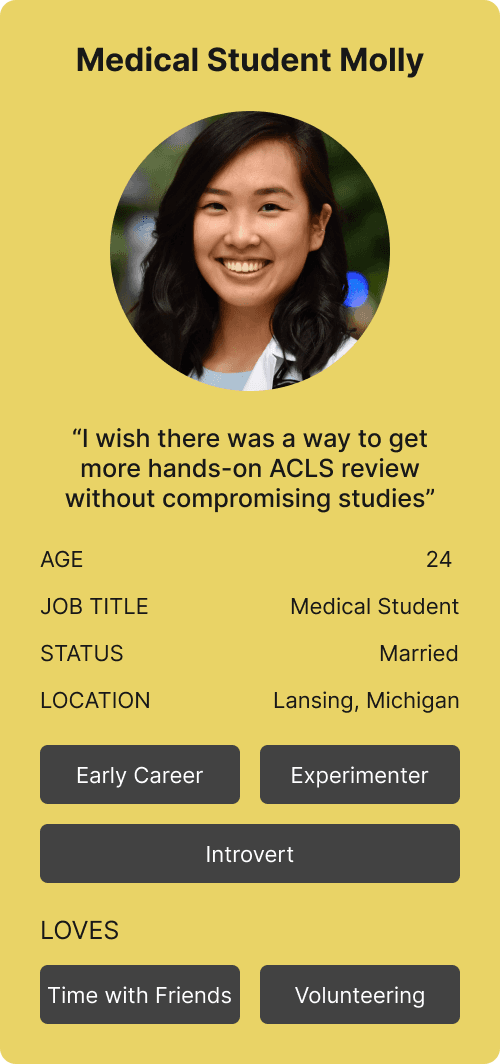
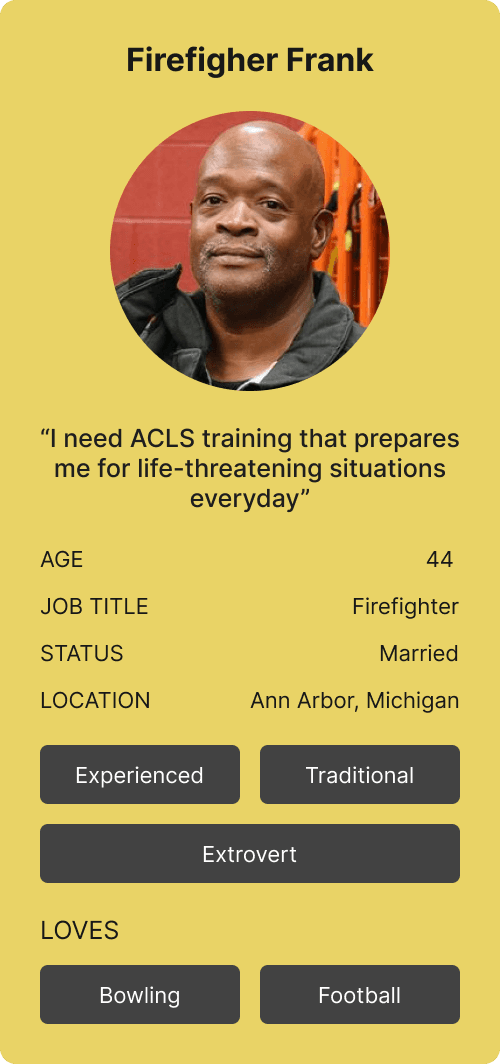
Personas
Following user interviews and competitive analysis, we developed three personas to represent the primary users of our feedback tool. This deepened our understanding of users' motivations, abilities, and needs.
Personas
Following user interviews and competitive analysis, we developed three personas to represent the primary users of our feedback tool. This deepened our understanding of users' motivations, abilities, and needs.

Background Research
Competitive Analysis
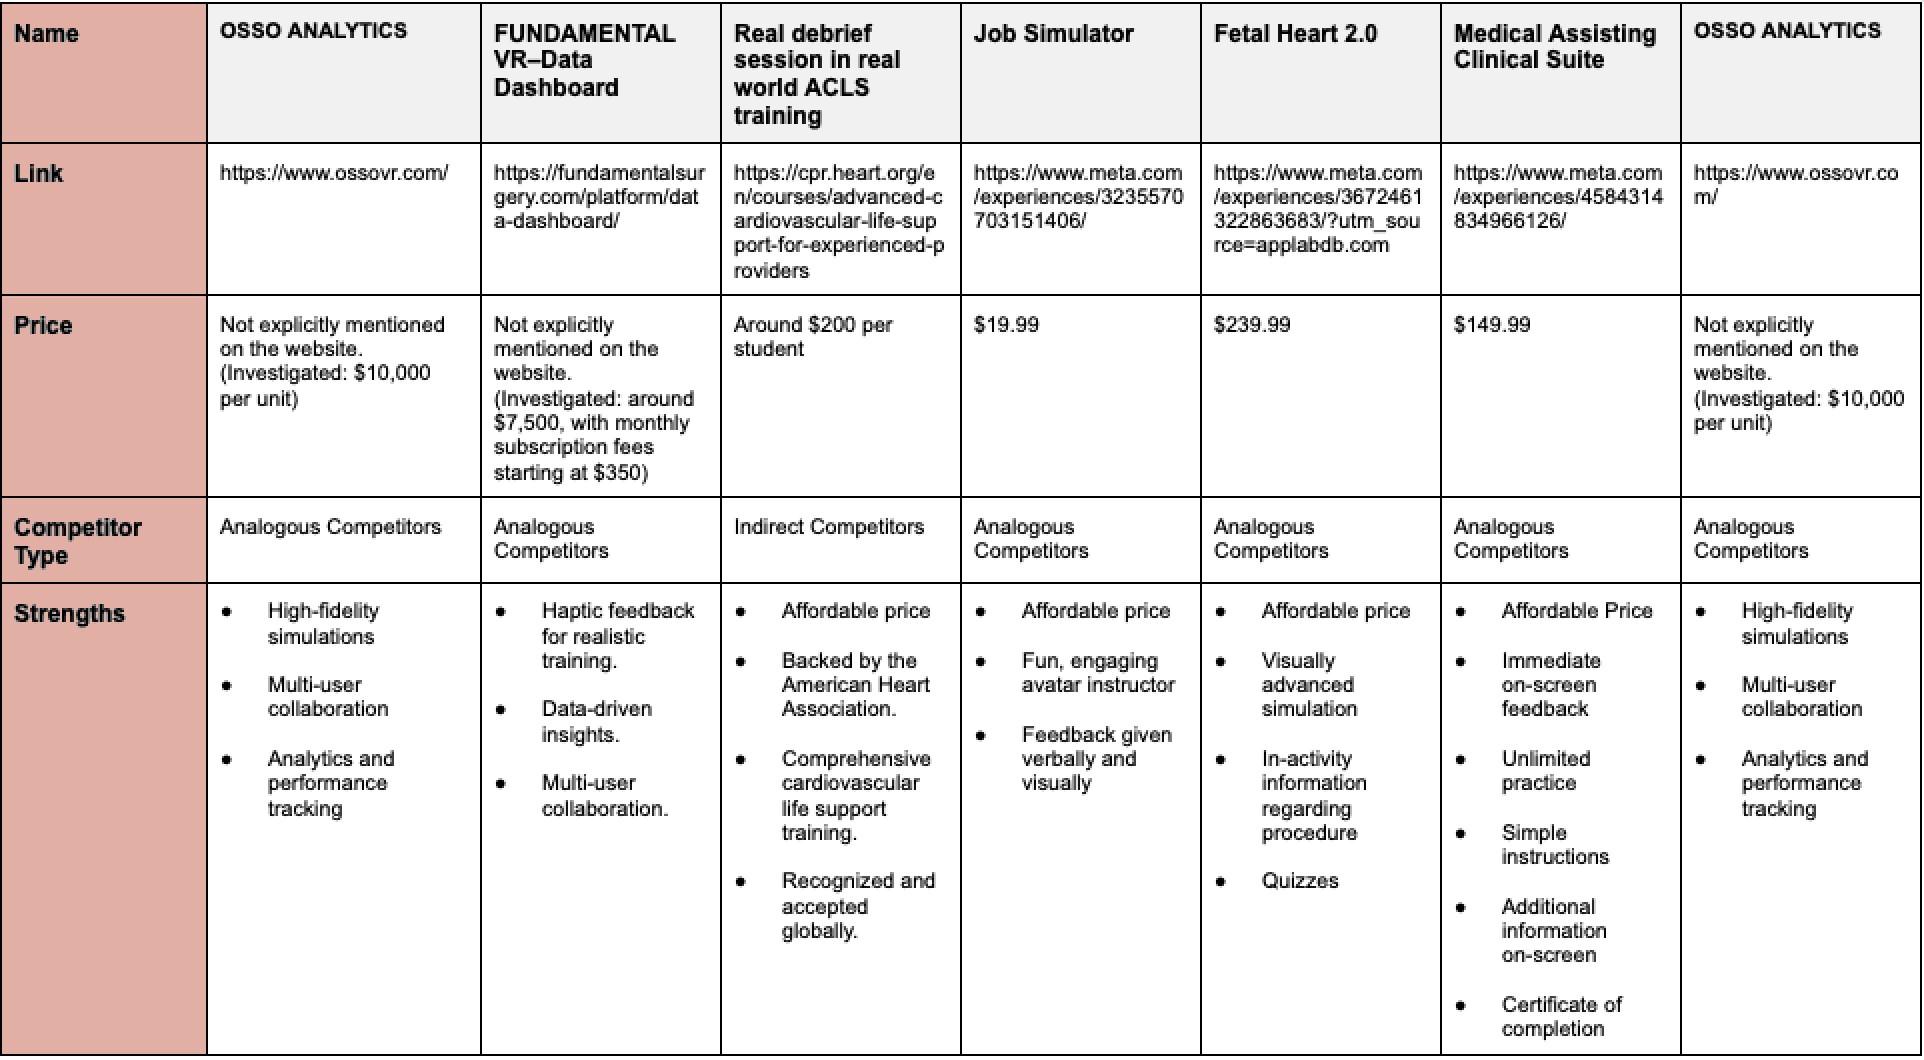
Following insights from user interviews, we conducted a competitive analysis to understand how other ACLS training products compare. This step aim edto identify market positioning and gain inspiration for our product’s features and design.
Background Research
Competitive Analysis
Following insights from user interviews, we conducted a competitive analysis to understand how other ACLS training products compare. This step aim edto identify market positioning and gain inspiration for our product’s features and design.
Background Research
Competitive Analysis
Following insights from user interviews, we conducted a competitive analysis to understand how other ACLS training products compare. This step aim edto identify market positioning and gain inspiration for our product’s features and design.
Background Research
Competitive Analysis
Following insights from user interviews, we conducted a competitive analysis to understand how other ACLS training products compare. This step aim edto identify market positioning and gain inspiration for our product’s features and design.
Ideation
Following the creation of personas, we generated eight distinct solutions to address their needs. This step aimed to explore a wide range of innovative options to ensure that we would find the most effective solution for our feedback tool.
During this stage we wanted to create many solutions. Later we would consider the value of each but what was most important was to create an environment where ideas could flow freely.
8 Solutions
8 Solutions
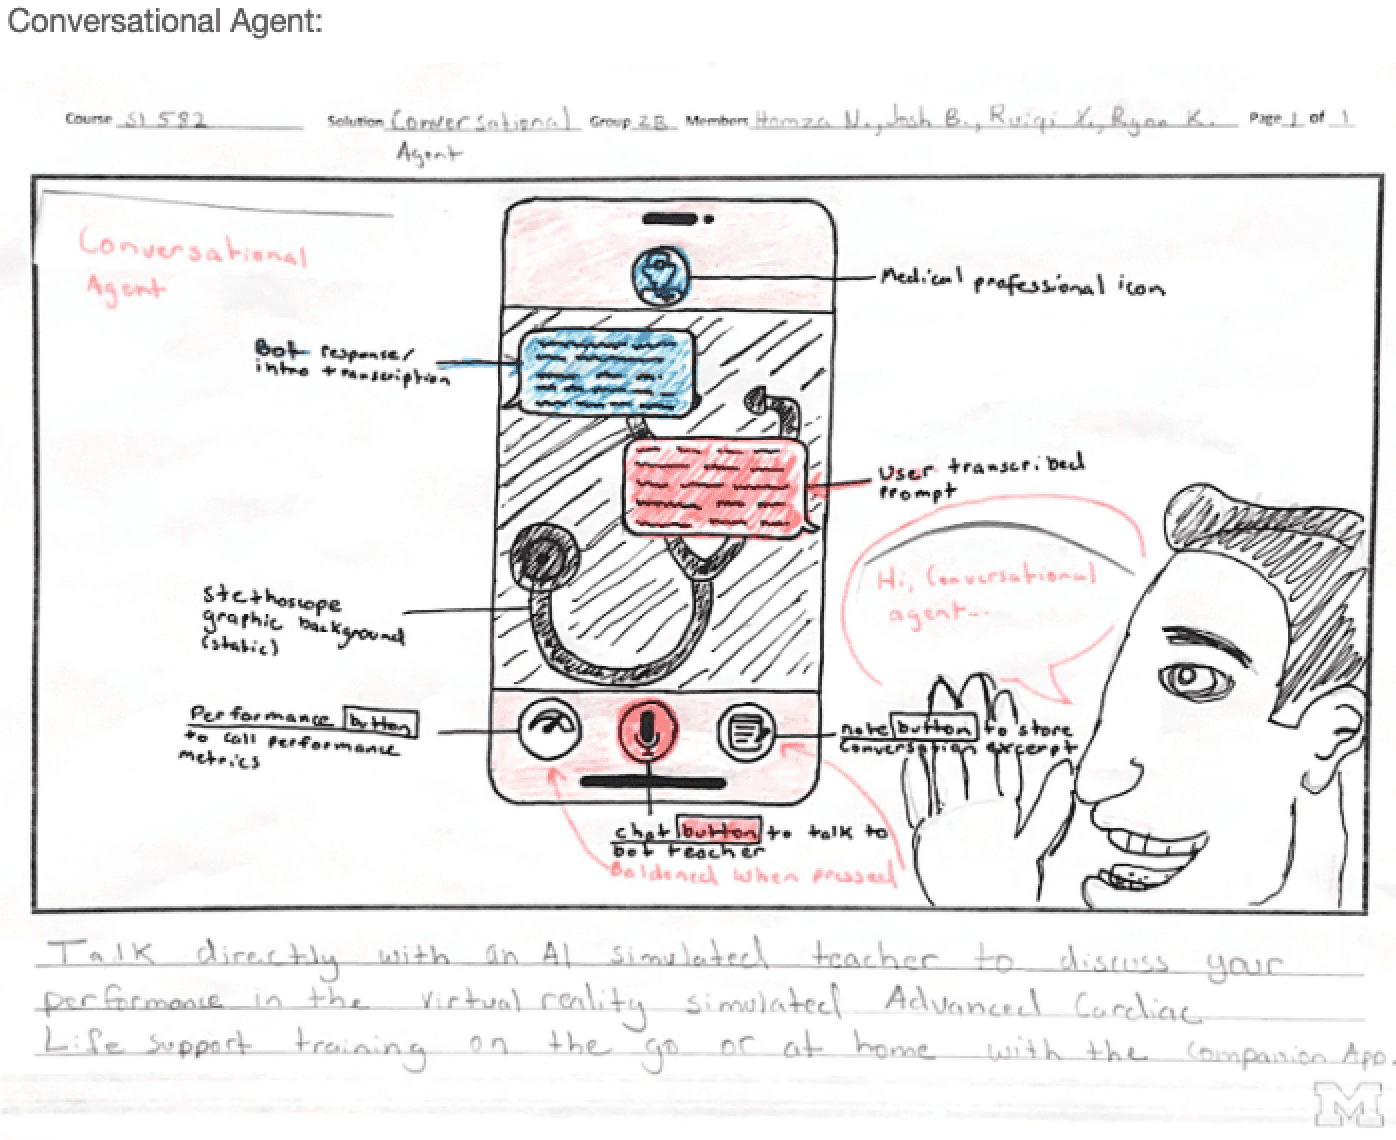
Conversational Agent
Text-Based: Real-time Q&A for immediate user support.
Conversational Agent
Text-Based: Real-time Q&A for immediate user support.
Companion App
Allows learners to review feedback data anytime.
Companion App
Allows learners to review feedback data anytime.
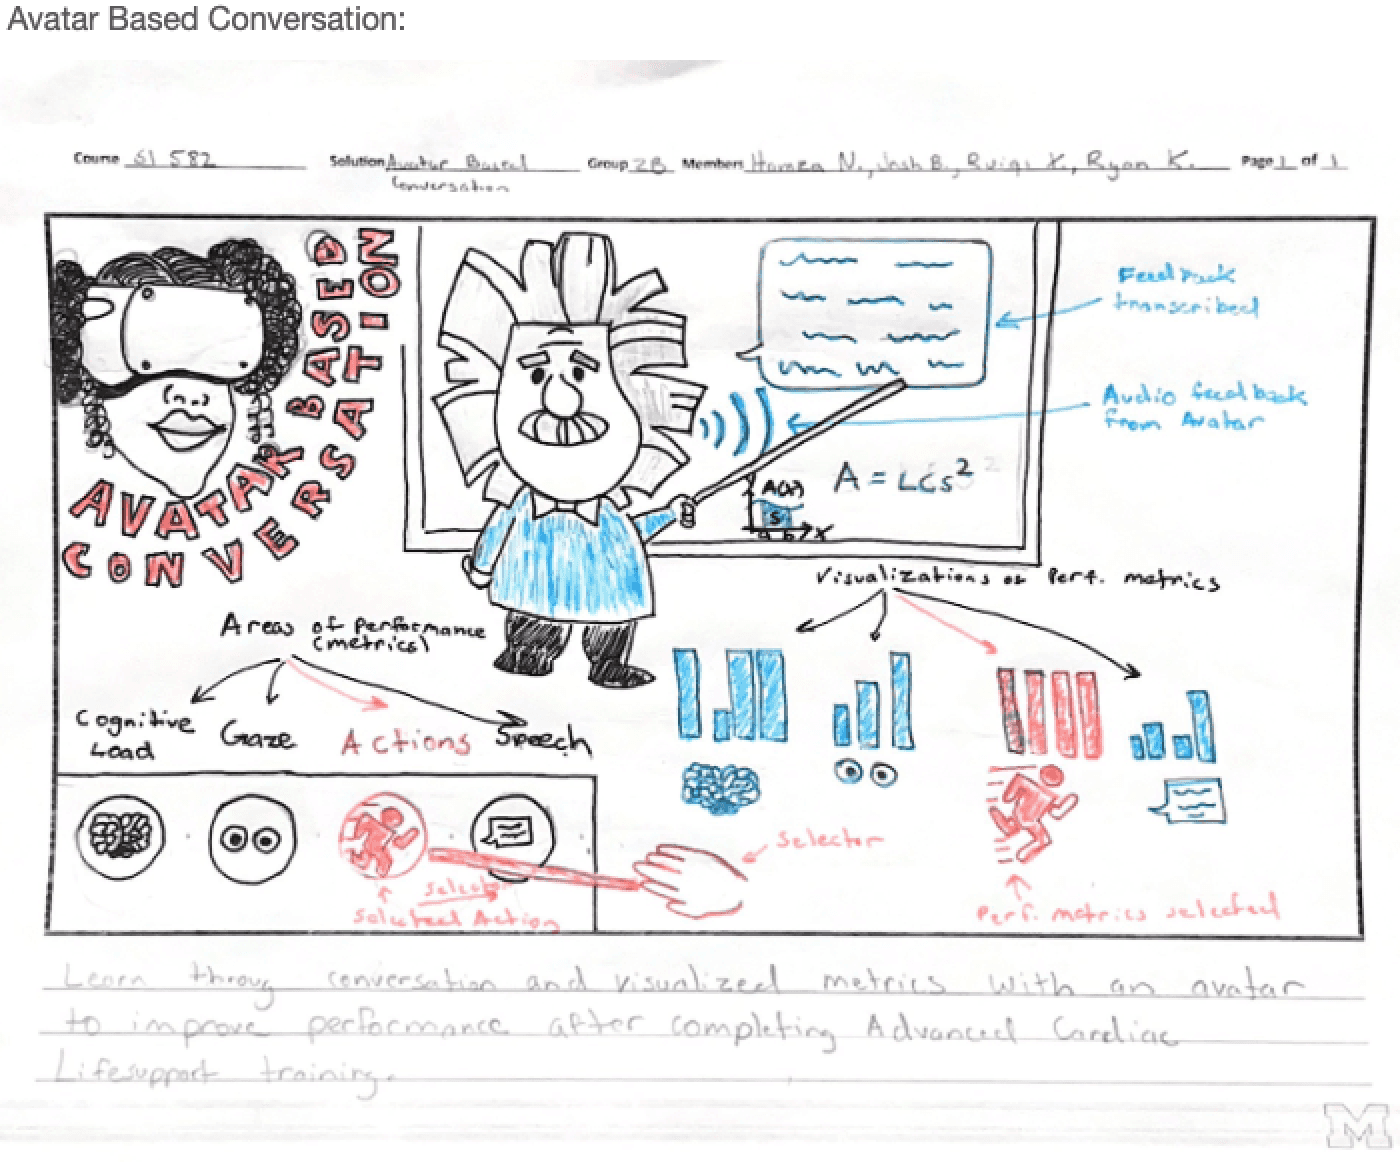
Avatar-Based Conversation Agent
AI-powered virtual instructor available on demand.
Avatar-Based Conversation Agent
AI-powered virtual instructor available on demand.
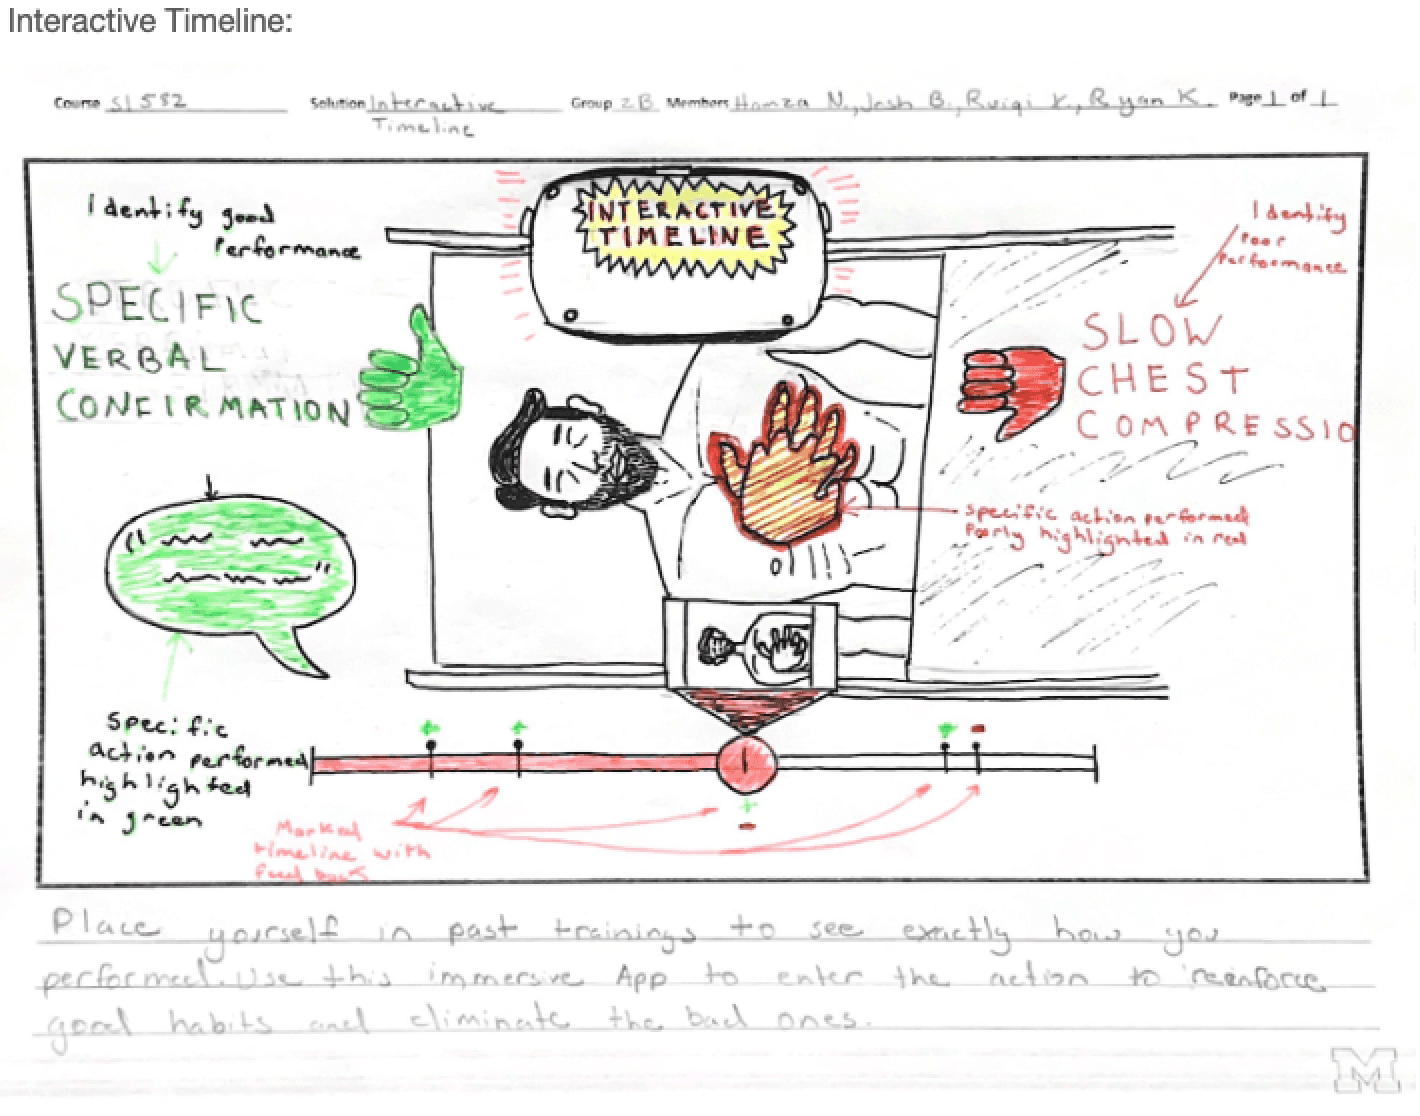
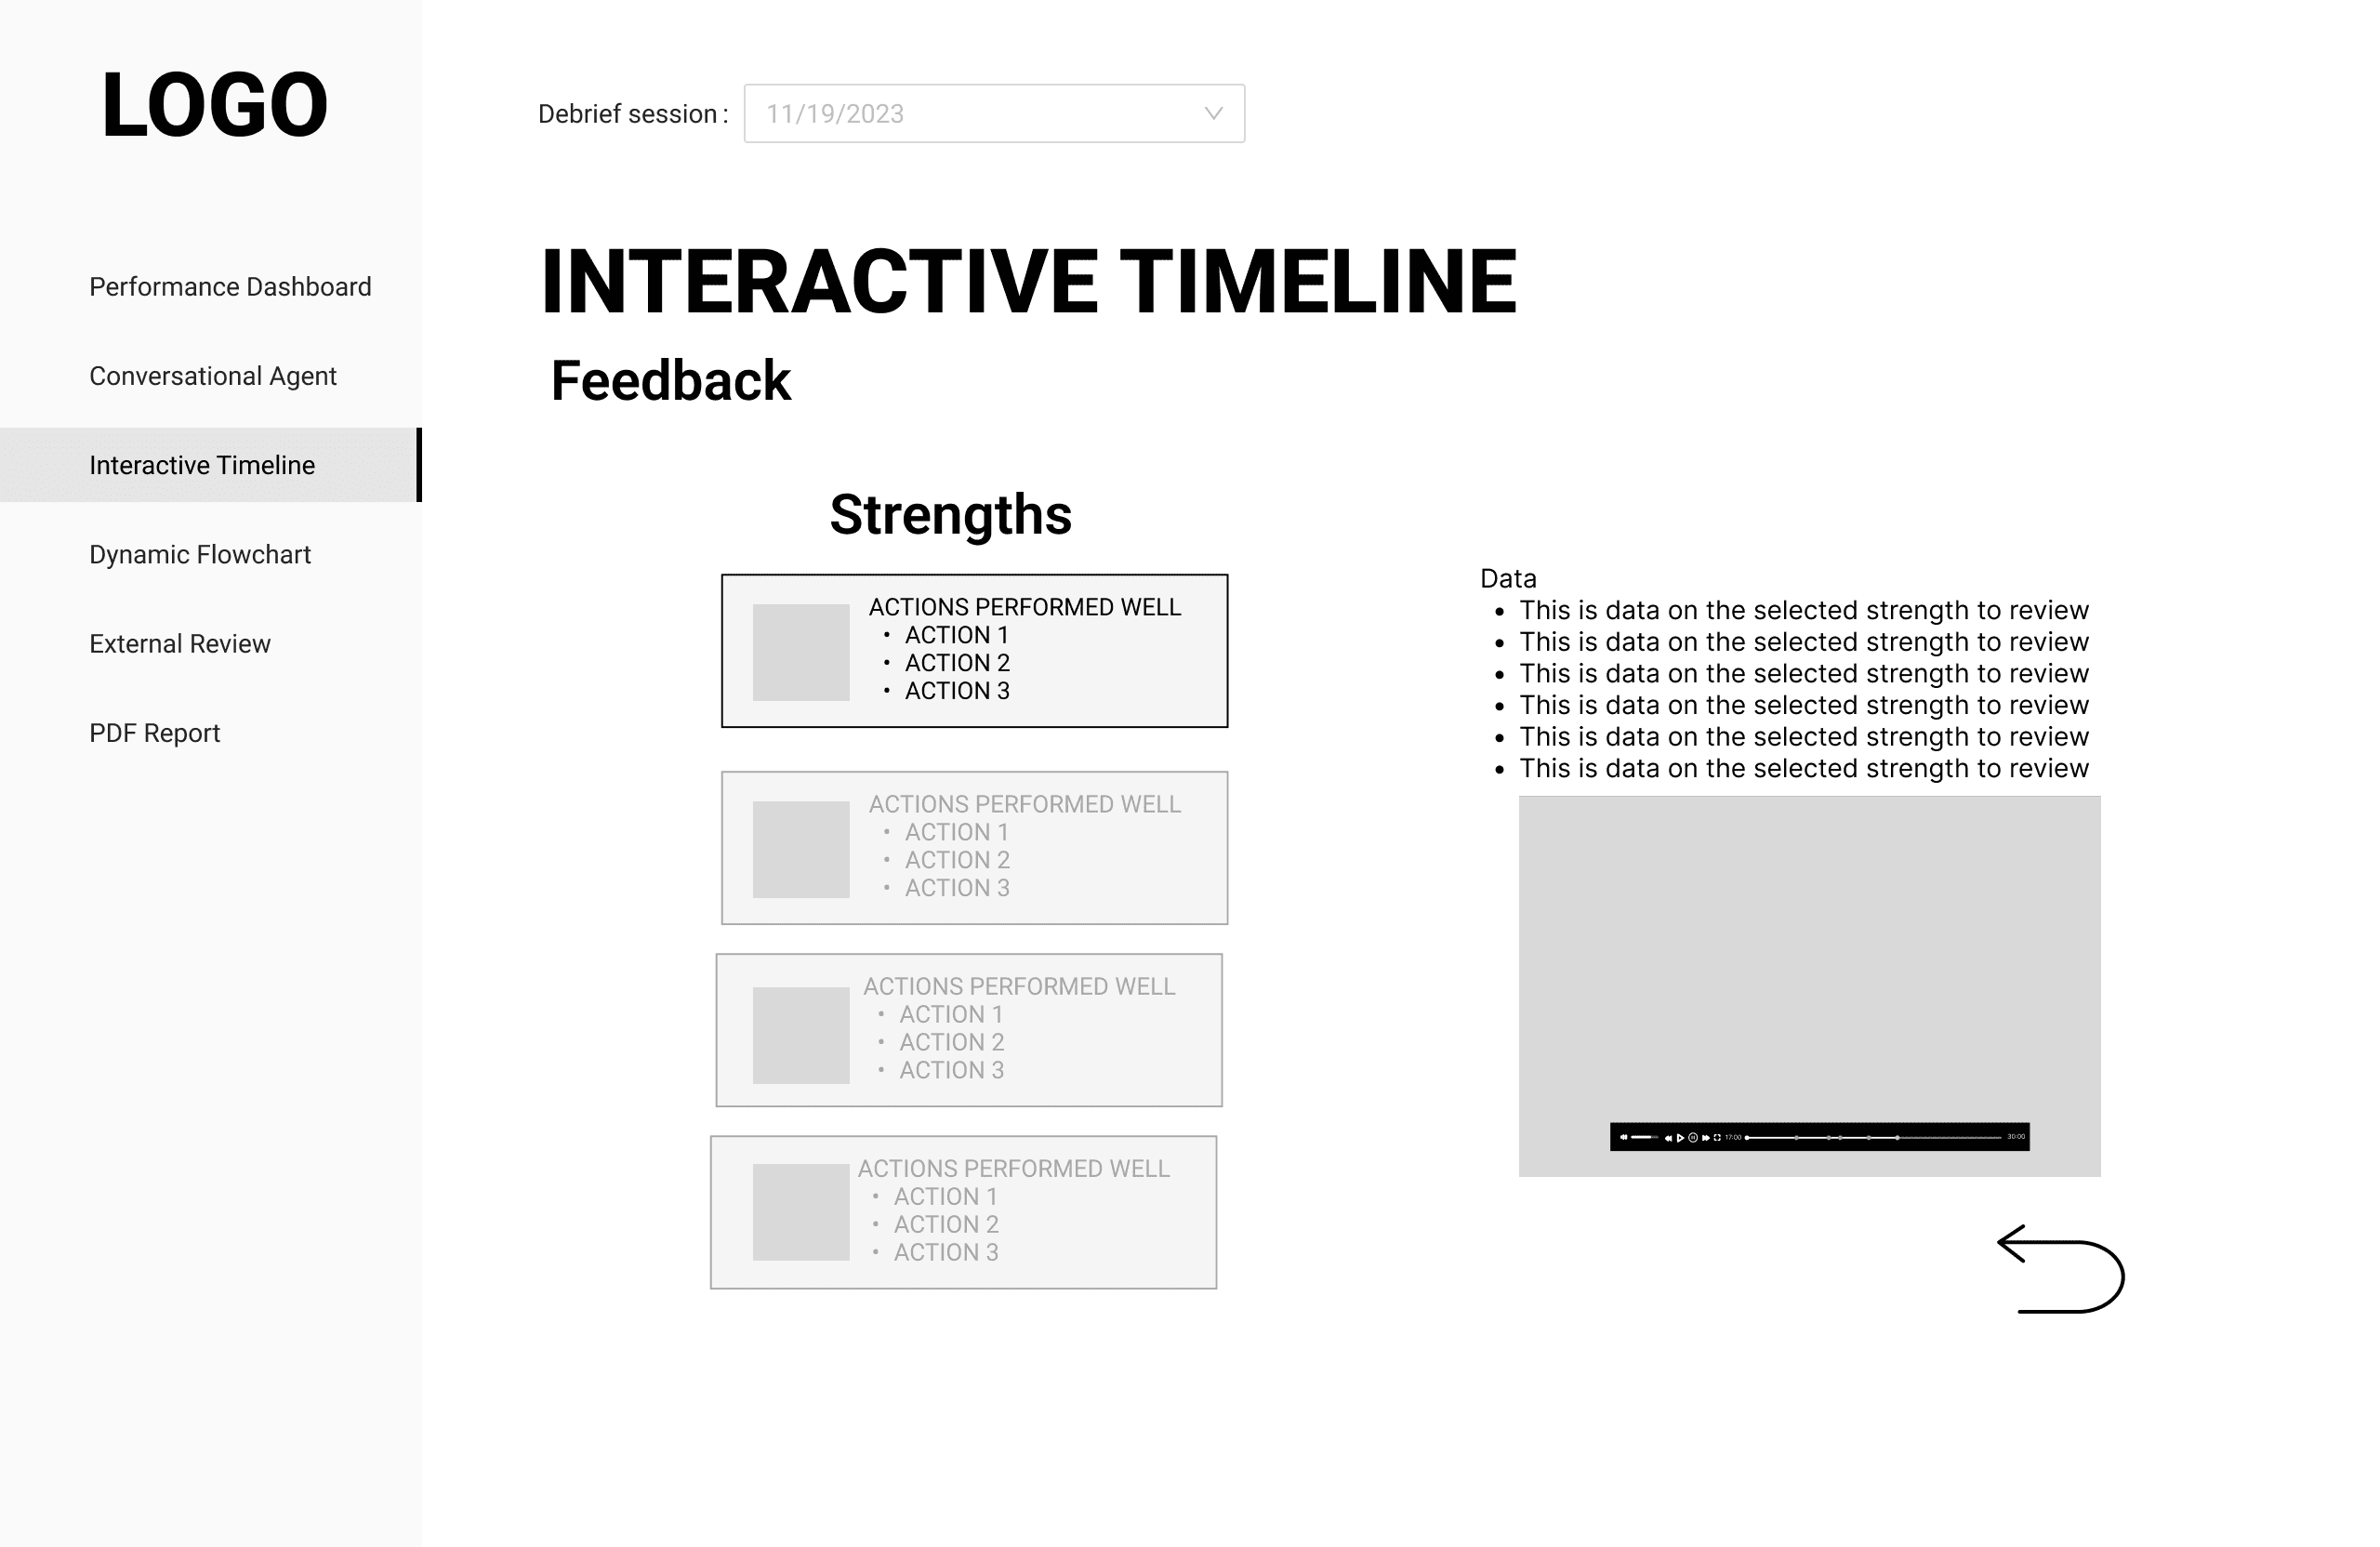
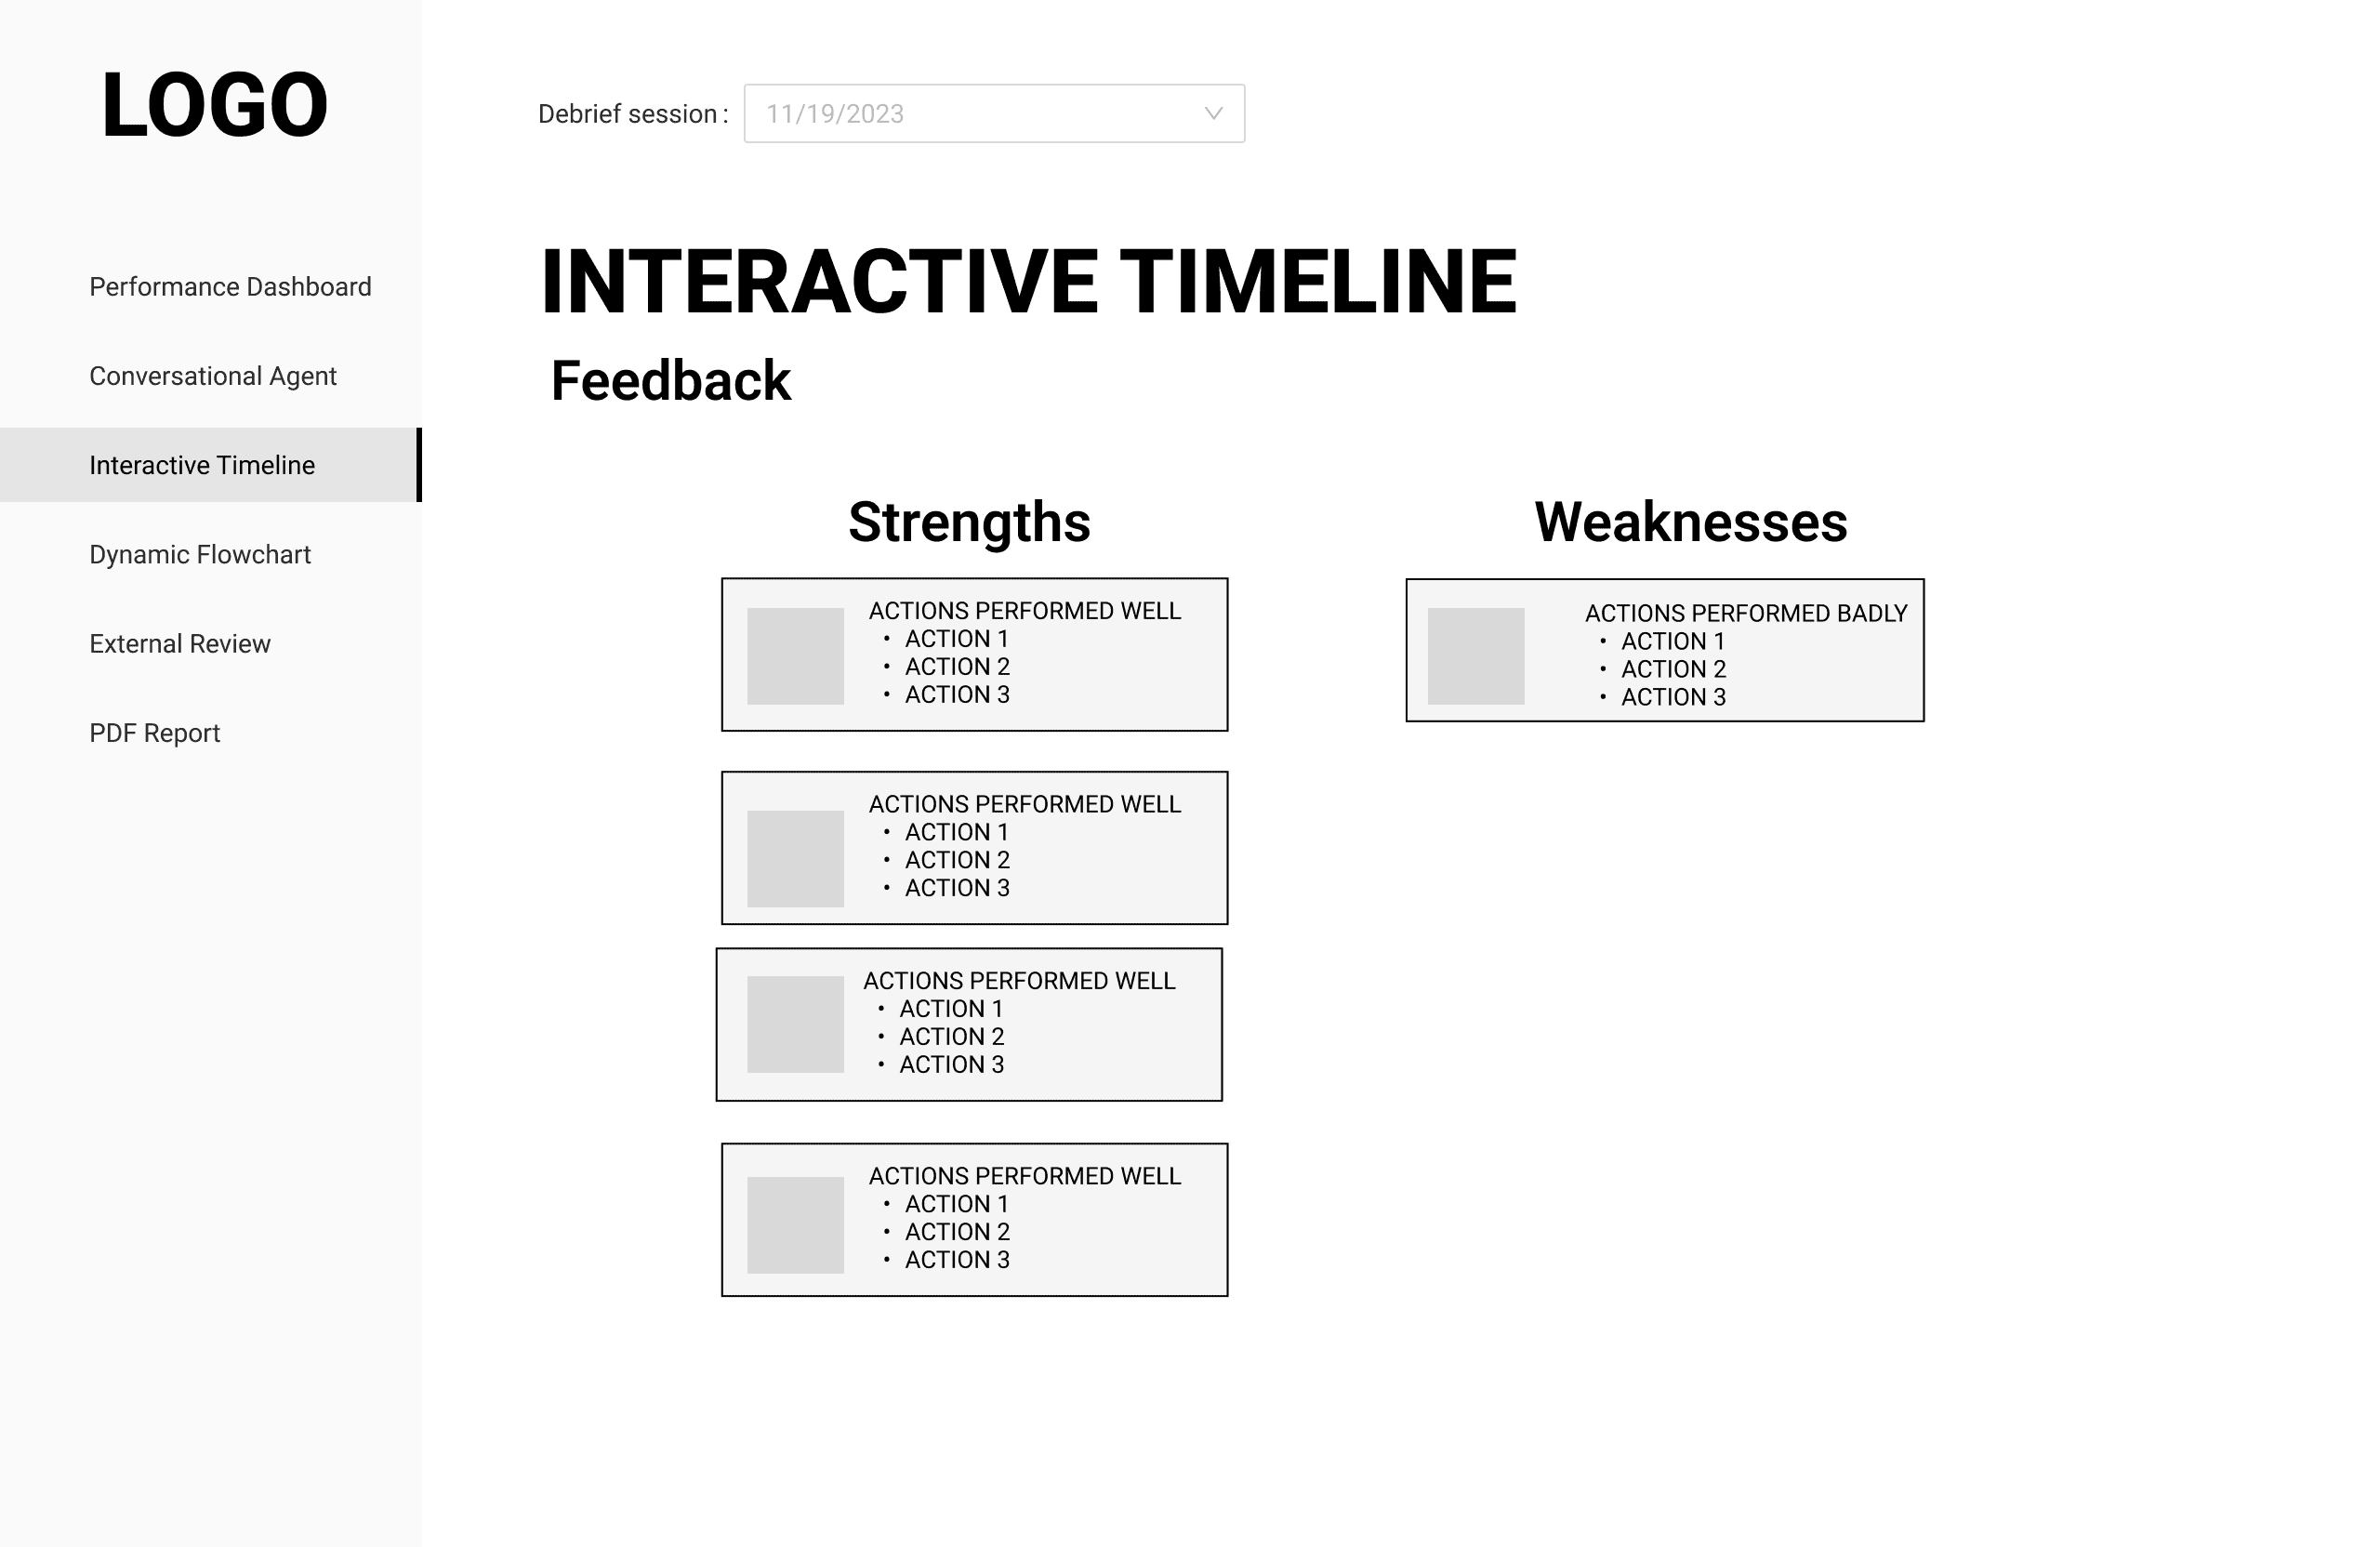
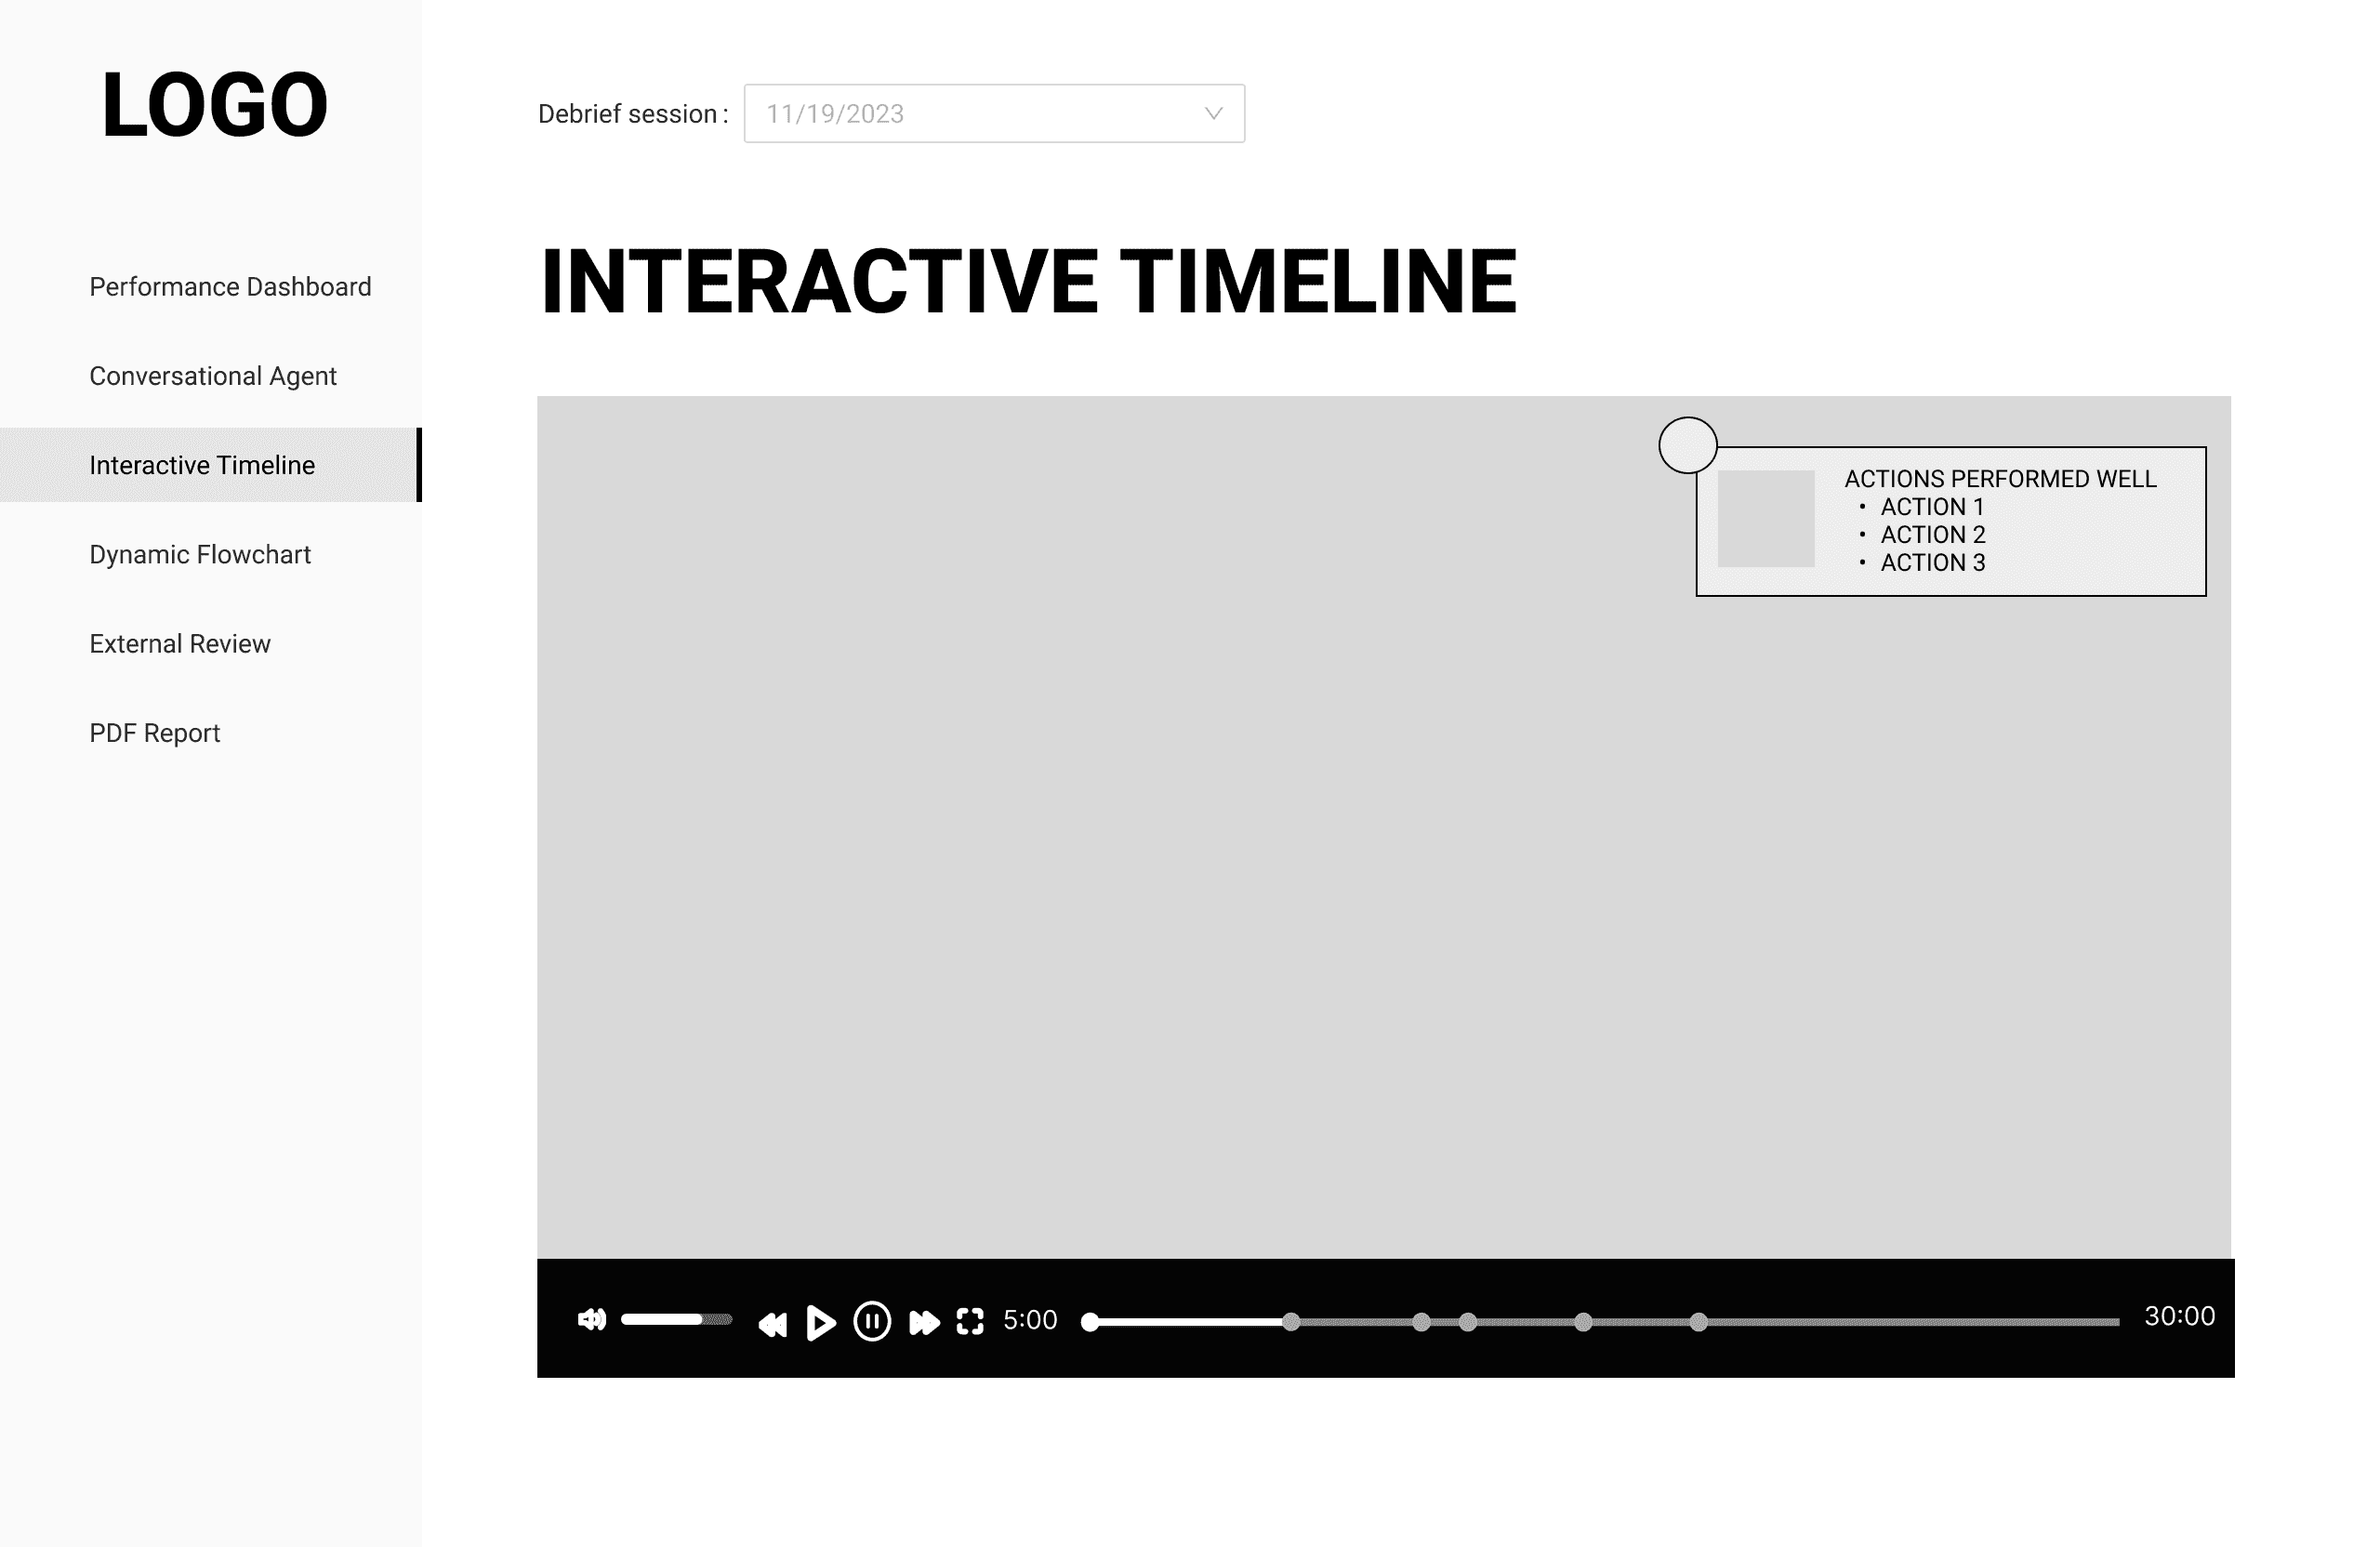
Interactive Timeline
Visualizes training activities, timings, and performance.
Interactive Timeline
Visualizes training activities, timings, and performance.
Web App Student Dashboard
Dashboard with key performance indicators for learners.
Web App Student Dashboard
Dashboard with key performance indicators for learners.
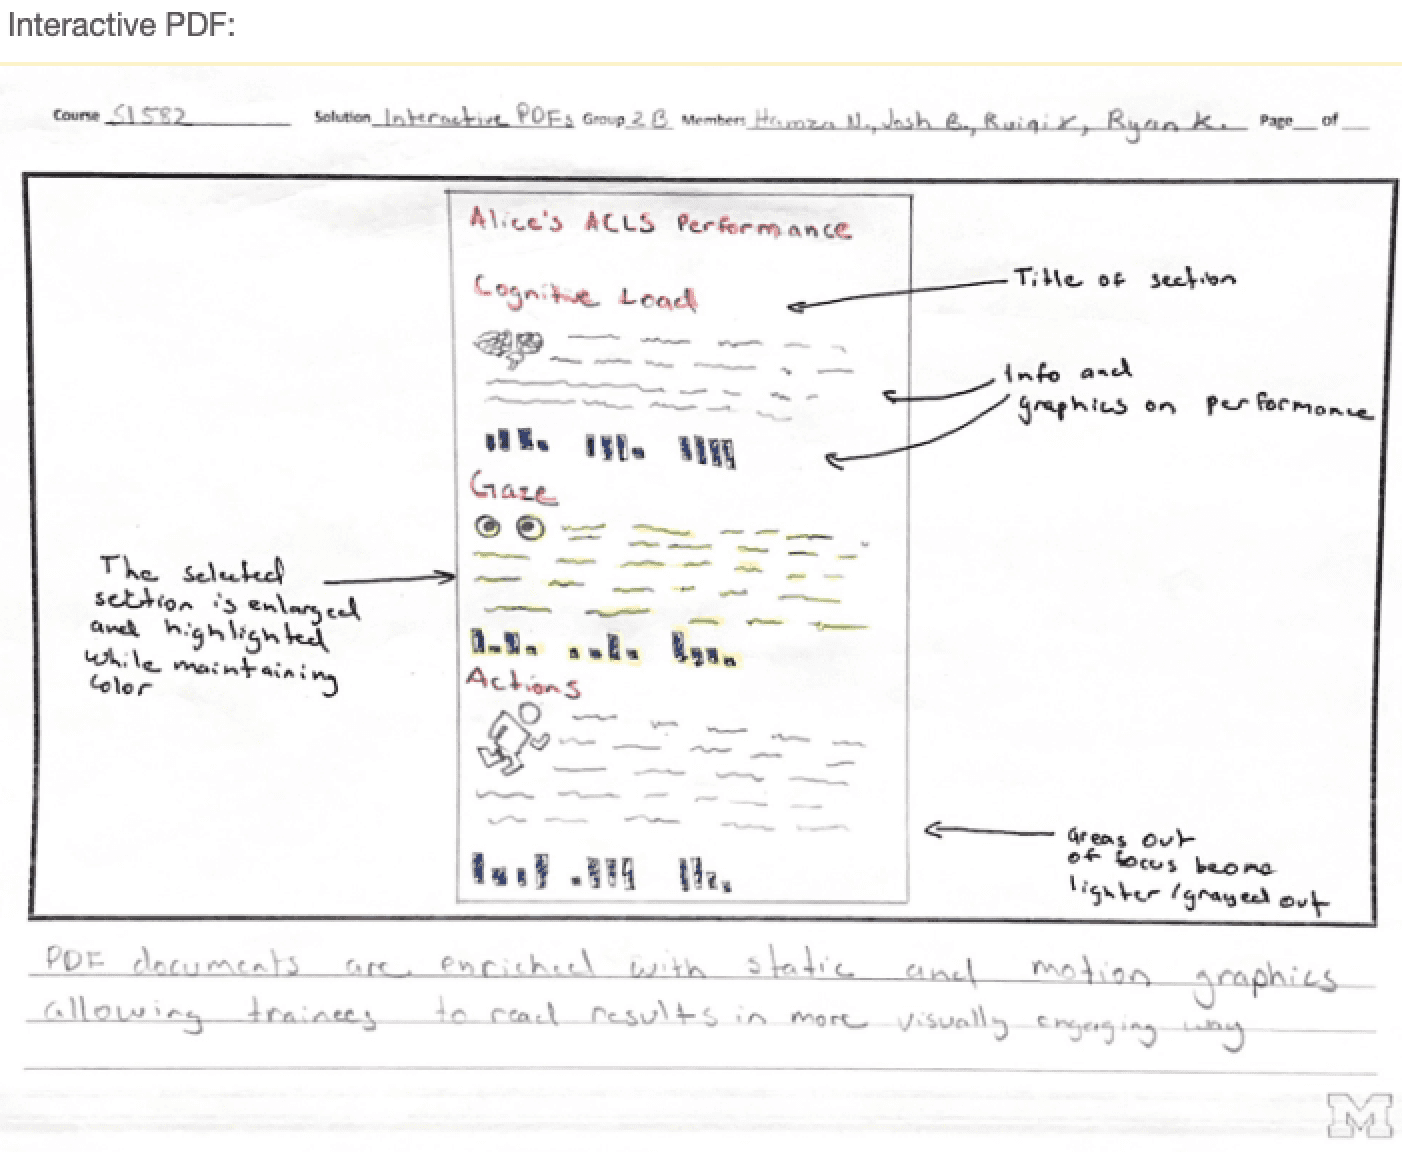
Interactive PDFs
Dynamic documents for interactive learning.
Interactive PDFs
Dynamic documents for interactive learning.
Peer Review Integration
Tracks learner interactions and peer ratings.
Peer Review Integration
Tracks learner interactions and peer ratings.
Dynamic Flowcharts
Visual aids for treatment paths and decision points.
Dynamic Flowcharts
Visual aids for treatment paths and decision points.


Questions, Options, and Criteria
After developing and sketching various solutions, we needed a systematic method to evaluate them. The Question, Option, and Criteria (QOC) analysis allowed us to rigorously compare each solution against predefined standards to determine the most effective approach.
Questions, Options, and Criteria
After developing and sketching various solutions, we needed a systematic method to evaluate them. The Question, Option, and Criteria (QOC) analysis allowed us to rigorously compare each solution against predefined standards to determine the most effective approach.
Questions, Options, and Criteria
After developing and sketching various solutions, we needed a systematic method to evaluate them. The Question, Option, and Criteria (QOC) analysis allowed us to rigorously compare each solution against predefined standards to determine the most effective approach.
Questions, Options, and Criteria
After developing and sketching various solutions, we needed a systematic method to evaluate them. The Question, Option, and Criteria (QOC) analysis allowed us to rigorously compare each solution against predefined standards to determine the most effective approach.

Scenario Creation
After developing and sketching various solutions, we needed a systematic method to evaluate them. The Question, Option, and Criteria (QOC) analysis allowed us to rigorously compare each solution against predefined standards to determine the most effective approach.
Scenario Creation
After developing and sketching various solutions, we needed a systematic method to evaluate them. The Question, Option, and Criteria (QOC) analysis allowed us to rigorously compare each solution against predefined standards to determine the most effective approach.
Scenario Creation
After developing and sketching various solutions, we needed a systematic method to evaluate them. The Question, Option, and Criteria (QOC) analysis allowed us to rigorously compare each solution against predefined standards to determine the most effective approach.
Scenario Creation
After developing and sketching various solutions, we needed a systematic method to evaluate them. The Question, Option, and Criteria (QOC) analysis allowed us to rigorously compare each solution against predefined standards to determine the most effective approach.
Methodology
Methodology
Devloped Detailed Scenarios
For each persona, we outlined their entire day before, during, and after using the feedback tool. Each scenario detailed the user's goals, interactions with agents and objects, settings, and actions taken.
Devloped Detailed Scenarios
For each persona, we outlined their entire day before, during, and after using the feedback tool. Each scenario detailed the user's goals, interactions with agents and objects, settings, and actions taken.
Illustrated User Experience
These scenarios helped us understand the personas' backgrounds and specific use cases, ensuring that the feedback tool was designed to meet their needs in various real-world contexts
Illustrated User Experience
These scenarios helped us understand the personas' backgrounds and specific use cases, ensuring that the feedback tool was designed to meet their needs in various real-world contexts

User Journey
Building on the scenarios, we created a user journey map that details the actions, thoughts, mindsets, and touchpoints of users across five key phases: Discovery, Onboarding, Initial Setup, Engagement, and Proficiency. This map helps visualize the complete user experience and identify areas for improvement.
The user journey map highlighted how users interact with the tool at each phase and their evolving needs and emotions. This insight enabled us to refine the design to better support users throughout their entire experience with the tool.

Story Mapping
Following the user journey mapping, we created story maps to visualize the steps and tasks required for users to achieve their desired outcomes. We developed both a common story map and individual story maps for each user type to capture unique needs and processes.
The story maps effectively highlighted the sequence of activities and tasks necessary for each user to reach their goals. This approach provided a clear and structured view of user interactions, revealing both common and unique pathways to success.
Methodology
Sequenced Activities
Organized activities into tasks and subtasks.
Arranged tasks chronologically from left to right and top to bottom.
Ensured all necessary steps were accounted for and logically sequenced.
Defined Desired Outcomes
Started with a clear outcome for the user, outlining their ultimate goal.
Defined Desired Outcomes
Started with a clear outcome for the user, outlining their ultimate goal.

Userflow Diagram
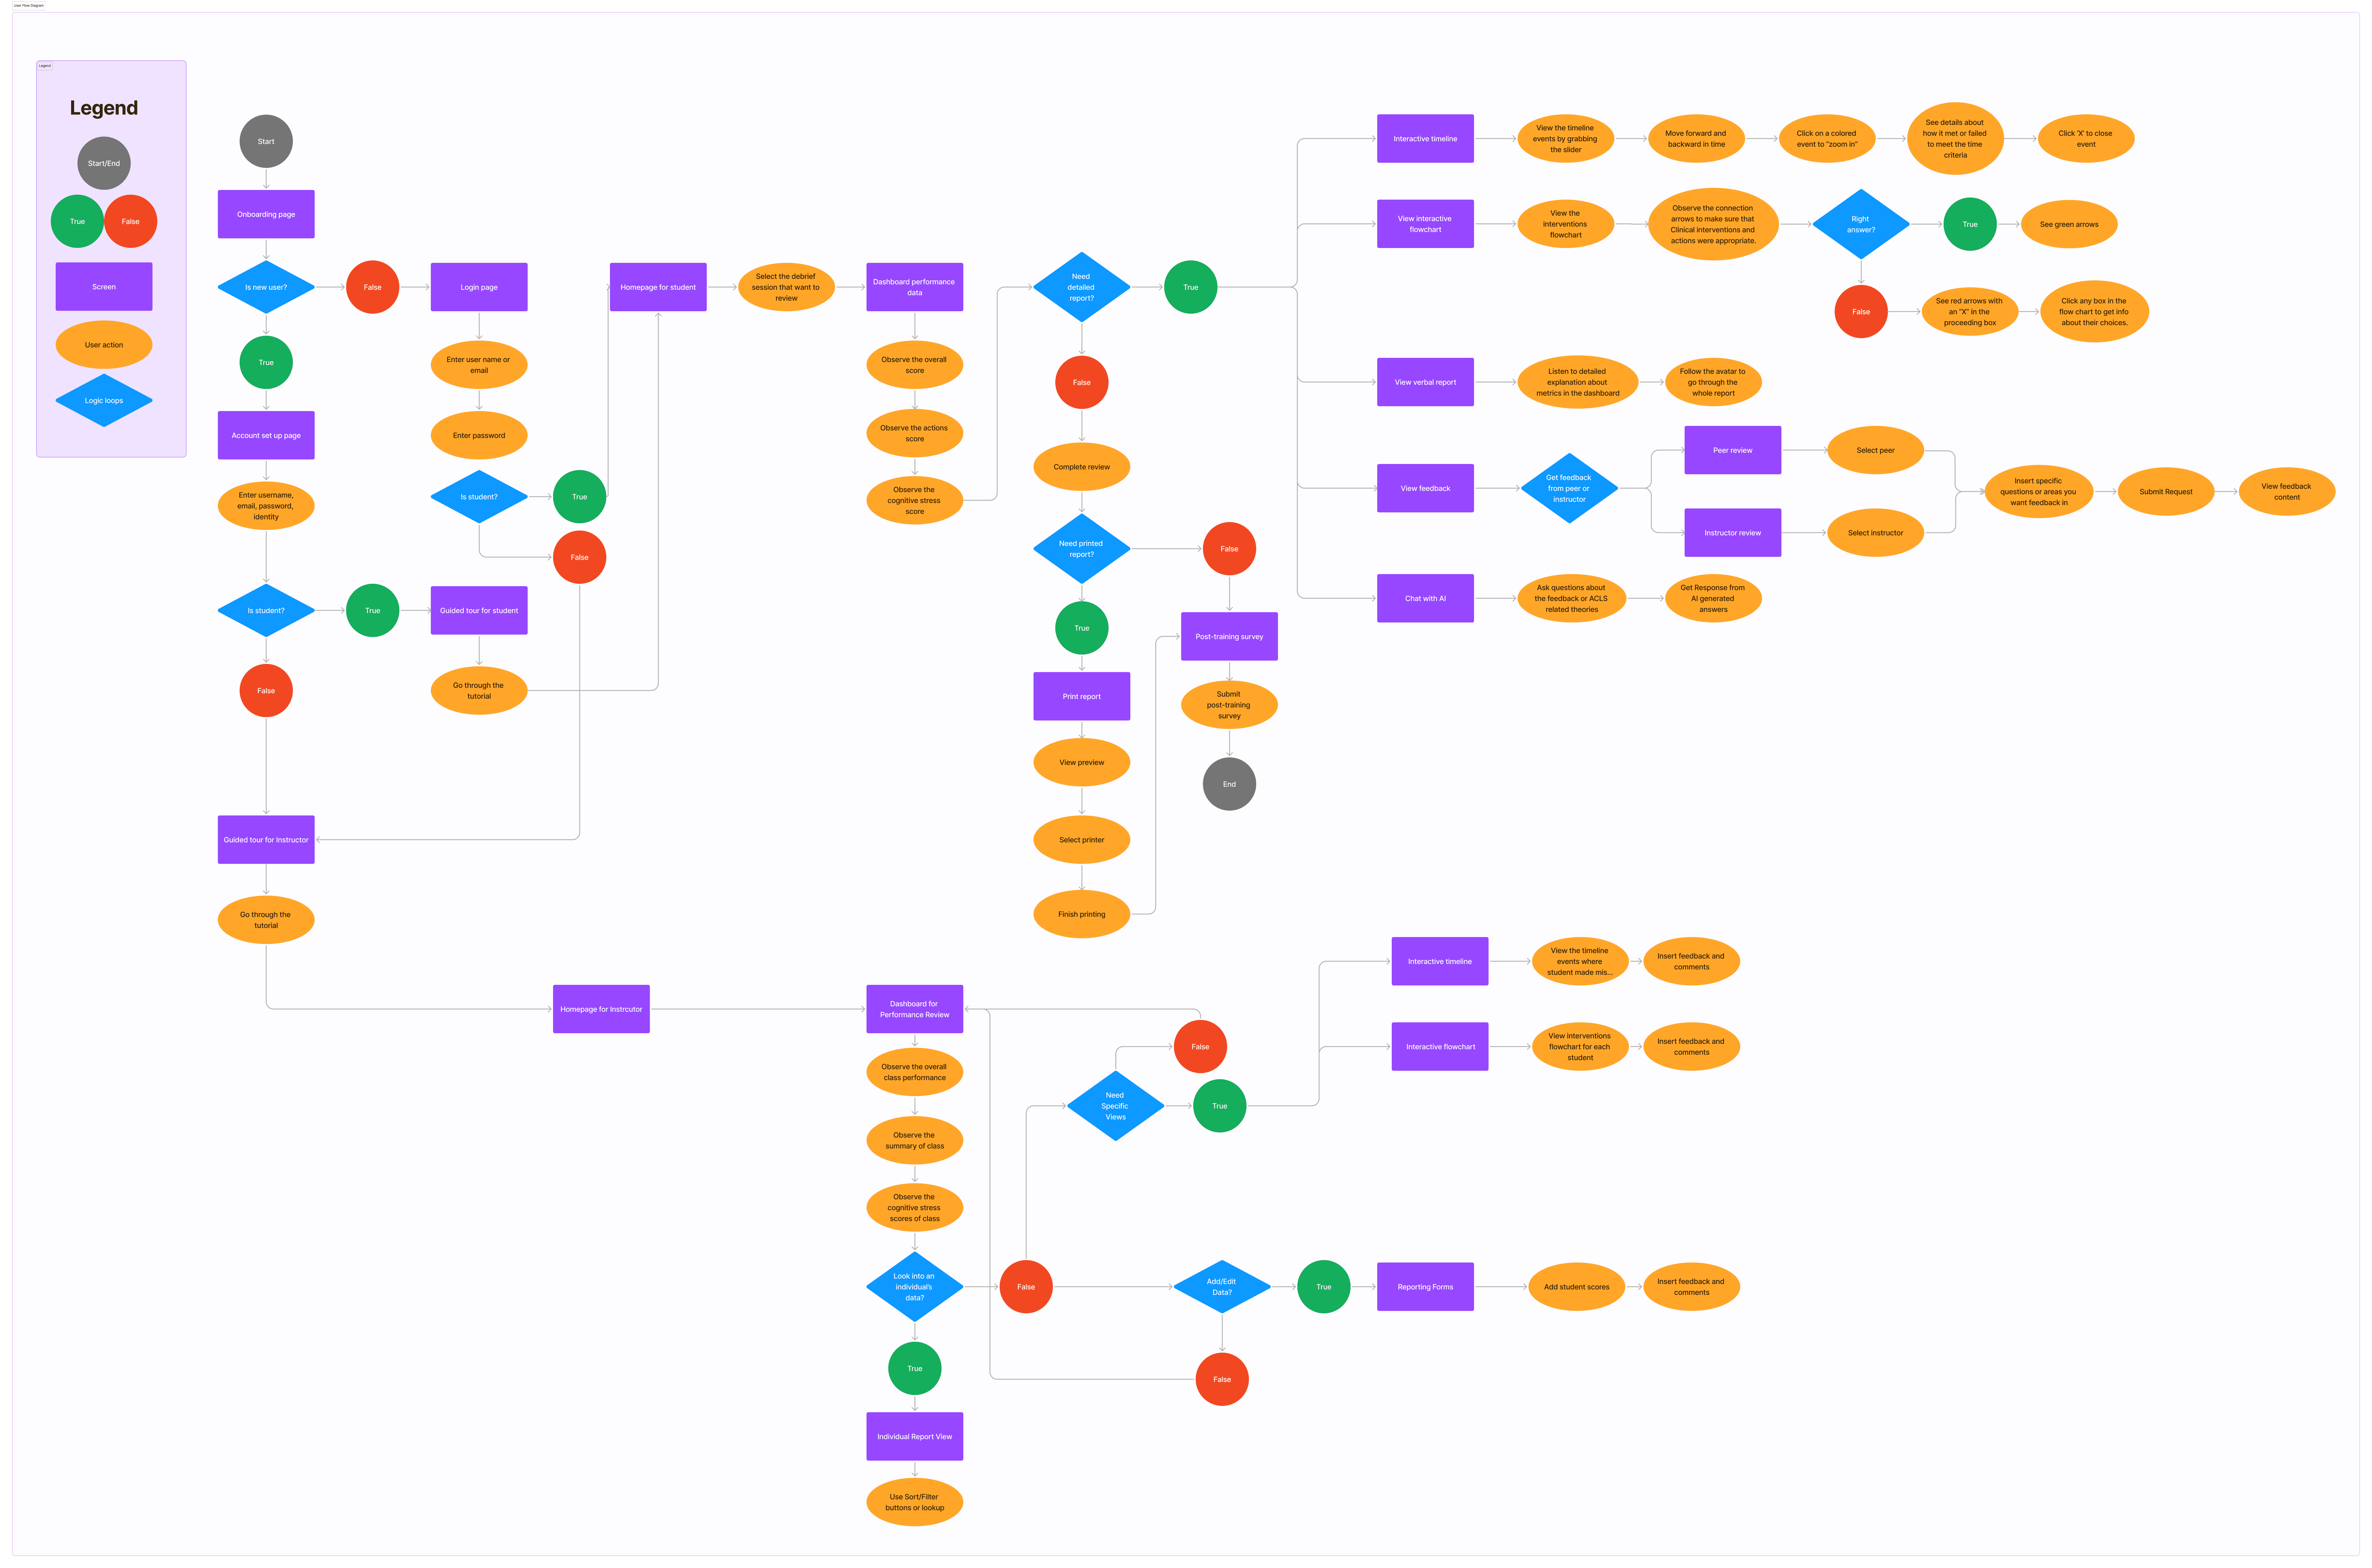
After mapping user journeys and storylines, we created a userflow diagram to define the specific screens and actions required to guide users through the tool. This diagram served as a roadmap for our lo-fi prototype, clarifying user interactions and decision points.
The userflow diagram effectively outlined the sequence of screens and user actions, providing a clear visual guide for the wireframing phase. It helped to resolve uncertainties and ensure that all user pathways were logically structured to achieve the desired outcomes.
Userflow Diagram
After mapping user journeys and storylines, we created a userflow diagram to define the specific screens and actions required to guide users through the tool. This diagram served as a roadmap for our lo-fi prototype, clarifying user interactions and decision points.
The userflow diagram effectively outlined the sequence of screens and user actions, providing a clear visual guide for the wireframing phase. It helped to resolve uncertainties and ensure that all user pathways were logically structured to achieve the desired outcomes.
Methodology
Identified Starting Point and Screens
Defined the initial screen.
Mapped out each subsequent screen.
Detailed options and user actions for navigation.
Mapped User Actions and Paths
Traced the user’s journey through the tool.
Illustrated actions leading to different screens.
Ensured a comprehensive flow covering all potential interactions.
Design
Wireframing
With the userflow diagram in hand, we proceeded to create wireframes to establish the basic structure and layout of the feedback tool. This step allowed us to visualize the tool’s functionality and interface without getting bogged down by design elements like color and imagery.
The wireframes provided a clear, practical view of how users would interact with the feedback tool, focusing solely on layout and navigation. This simplified approach enabled us to quickly iterate on the design and address usability issues before advancing to more detailed design phases.
Design
Wireframing
with the userflow diagram in hand, we proceeded to create wireframes to establish the basic structure and layout of the feedback tool. This step allowed us to visualize the tool’s functionality and interface without getting bogged down by design elements like color and imagery.
The wireframes provided a clear, practical view of how users would interact with the feedback tool, focusing solely on layout and navigation. This simplified approach enabled us to quickly iterate on the design and address usability issues before advancing to more detailed design phases.
Methodology
Designing Flows
Each team member designed 1 to 2 flows.
Ensured diverse perspectives and comprehensive user interaction coverage.
Focus on Structure
Mapped out basic layout, navigation paths, and key elements.
Avoided detailed design choices like color and imagery for rapid development and iteration.
Low Fidelity Prototype
Following the wireframes, we developed a low fidelity prototype to add visual elements like icons and colors, bringing the tool's design to life. This phase added a crucial layer of detail, allowing us to further refine the user experience and interface.
The low fidelity prototype provided a more tangible sense of the tool's appearance and functionality, helping us identify areas for improvement in visual hierarchy and usability. By integrating basic visual elements, we were able to evaluate the overall design effectiveness before moving on to high-fidelity mockups.
Methodology
Enhancing Design Elements
Enhancing Design Elements:
Added icons, colors, and images to wireframes.
Helped visualize the flow and overall look of the tool.
Refining User Interaction
Assessed how visual elements impact user interactions.
Made adjustments to improve design clarity and effectiveness.


Usability and Accessibility Testing
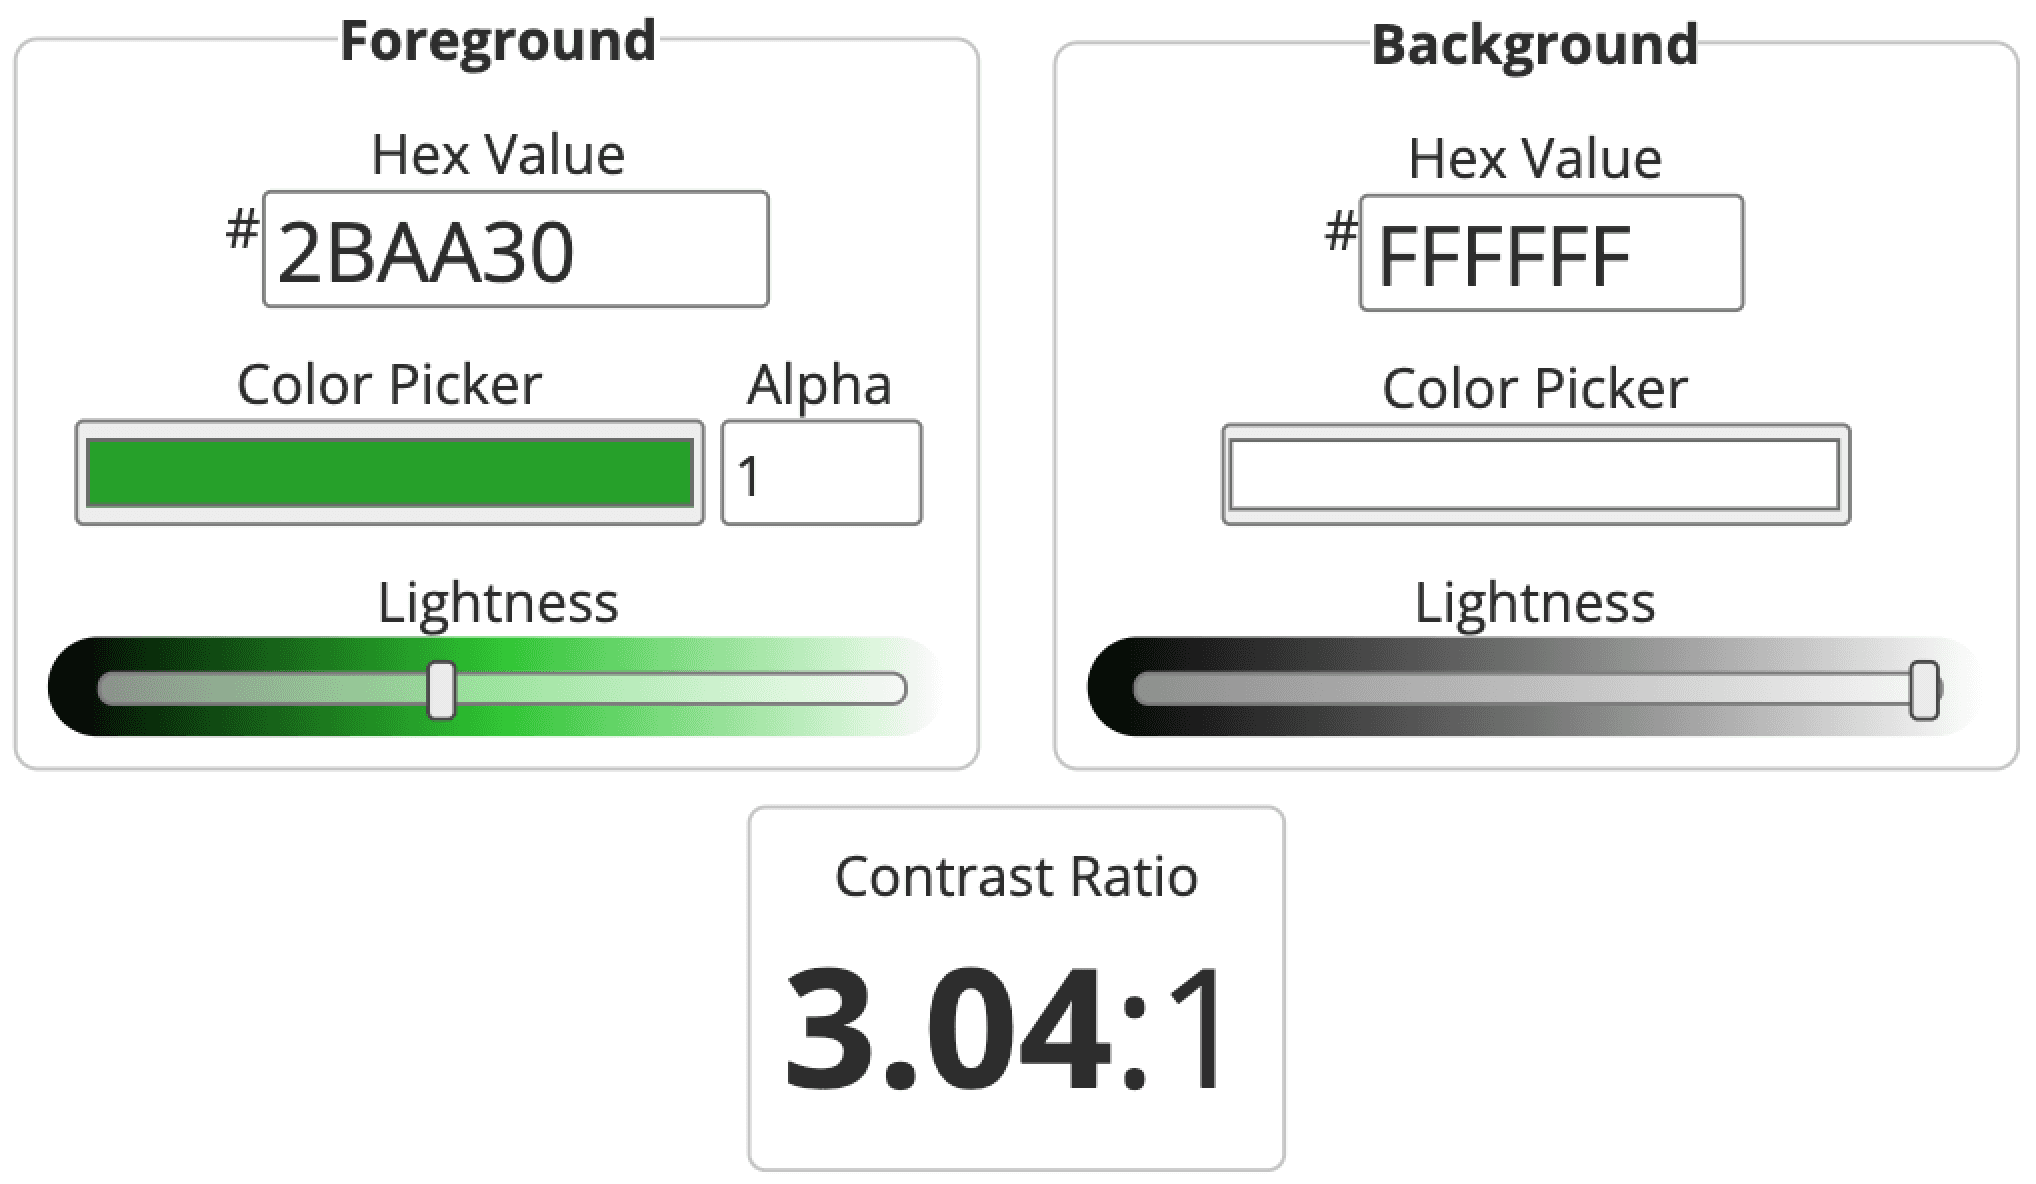
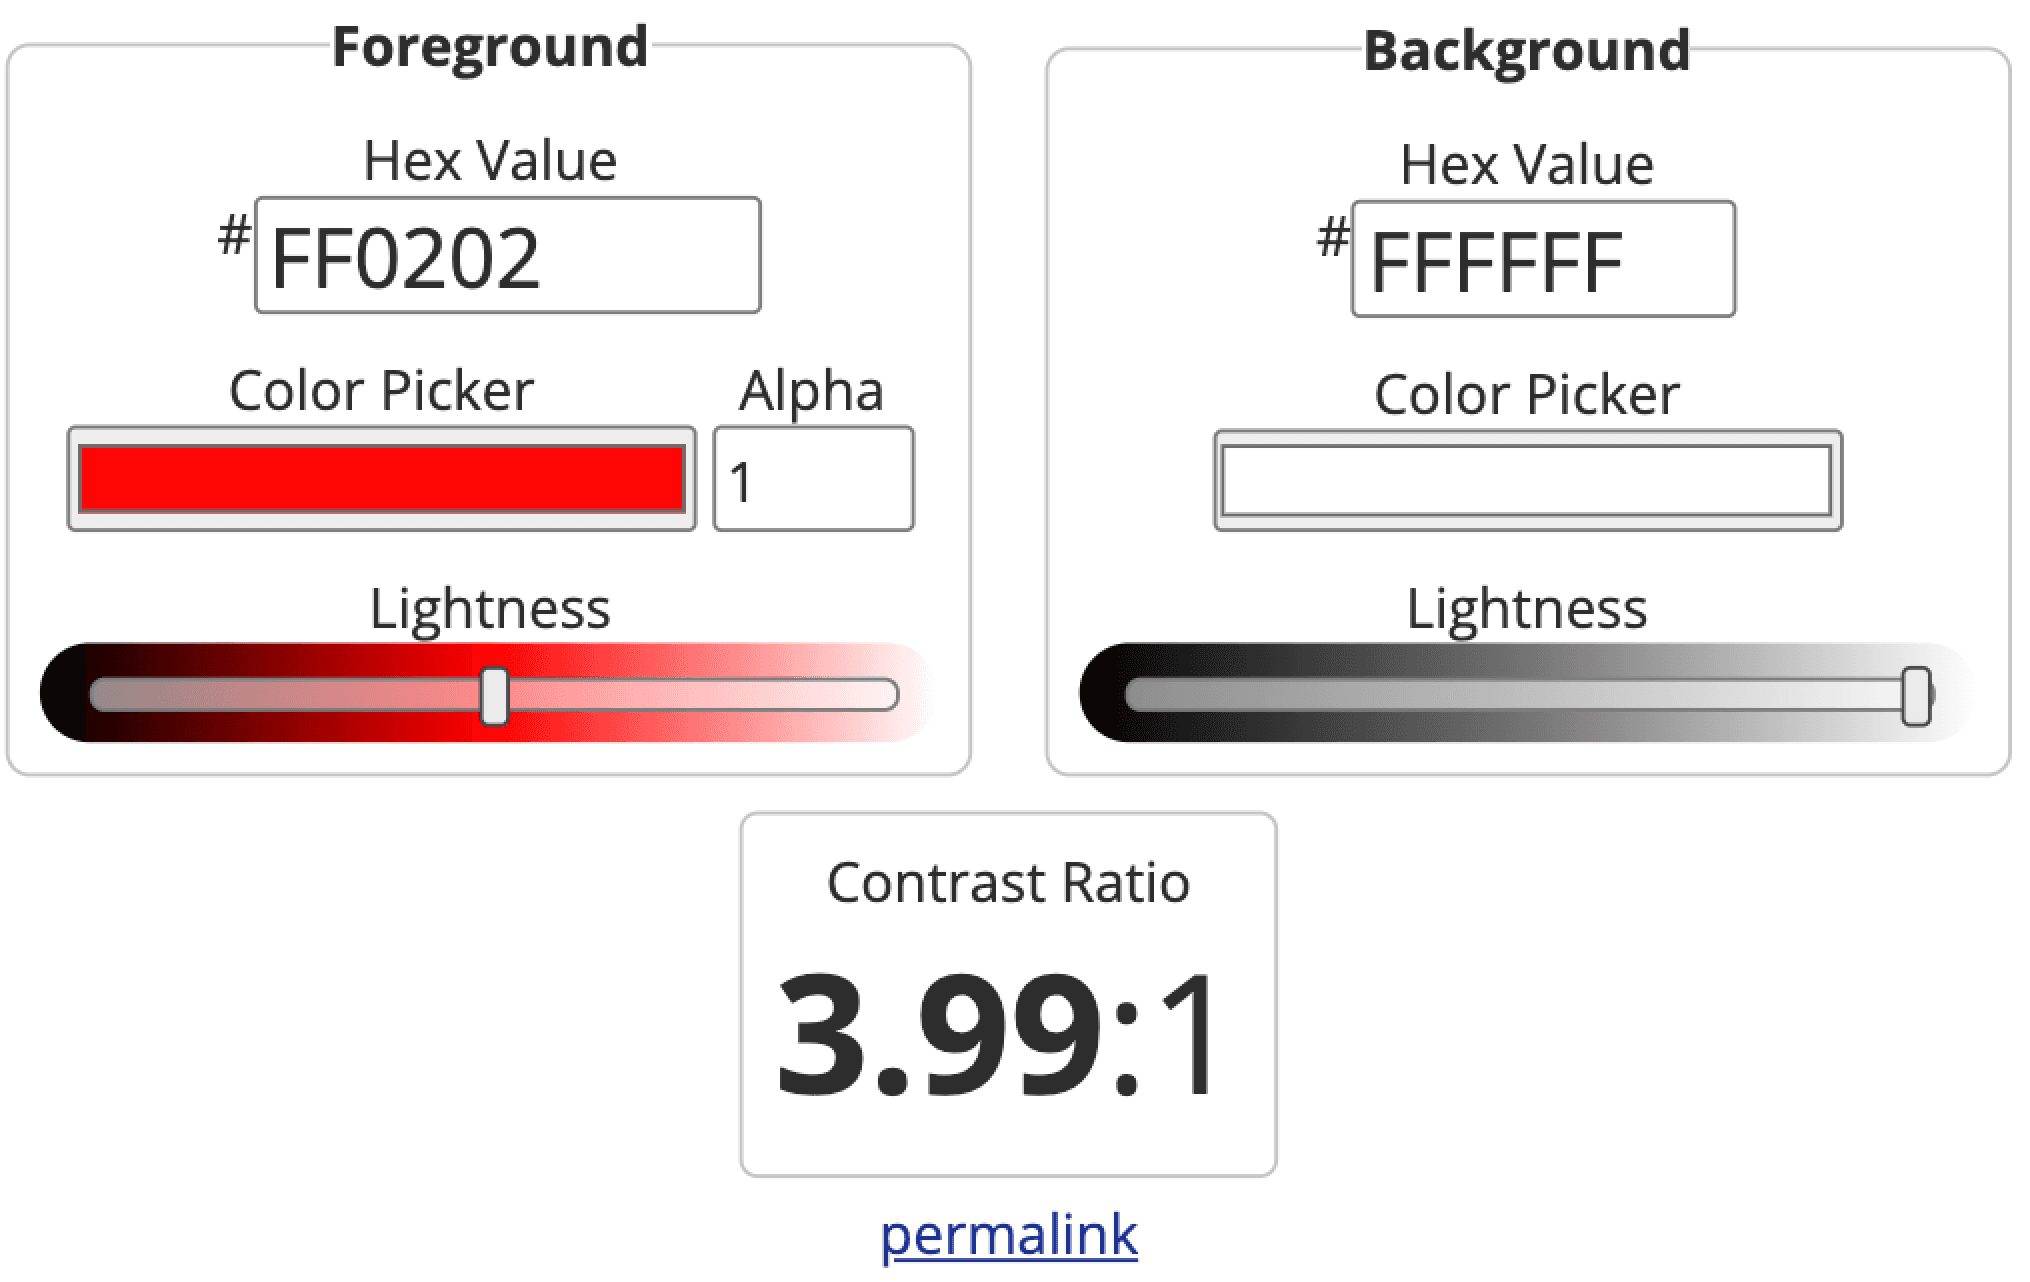
Following the creation of the low fidelity prototype, user and accessibility testing were conducted to ensure the design effectively met user needs and to validate its accessibility features. This step aimed to uncover usability issues and confirm that the color choices were suitable for users with vision impairments.
User testing revealed that while the interface's simplicity was appreciated, some color choices were visually irritating, and the layout of details needed adjustment for better readability. Accessibility testing confirmed that the color contrast met standards, though specific visual adjustments were suggested to enhance overall user comfort.
Usability and Accessibility Testing
Following the creation of the low fidelity prototype, user and accessibility testing were conducted to ensure the design effectively met user needs and to validate its accessibility features. This step aimed to uncover usability issues and confirm that the color choices were suitable for users with vision impairments.
User testing revealed that while the interface's simplicity was appreciated, some color choices were visually irritating, and the layout of details needed adjustment for better readability. Accessibility testing confirmed that the color contrast met standards, though specific visual adjustments were suggested to enhance overall user comfort.
Methodology
User Testing
Goal Setting: Provided users with a list of goals to explore the tool freely.
Testing Protocol: Developed a clear protocol to ensure consistent testing.
Execution: Each team member tested their flows with two external participants, gathering insights on usability and user experience.
Accessibility Testing
Color Contrast Evaluation: Used WebAIM’s color contrast checker to ensure color readability and compliance with accessibility standards for users with vision impairments.
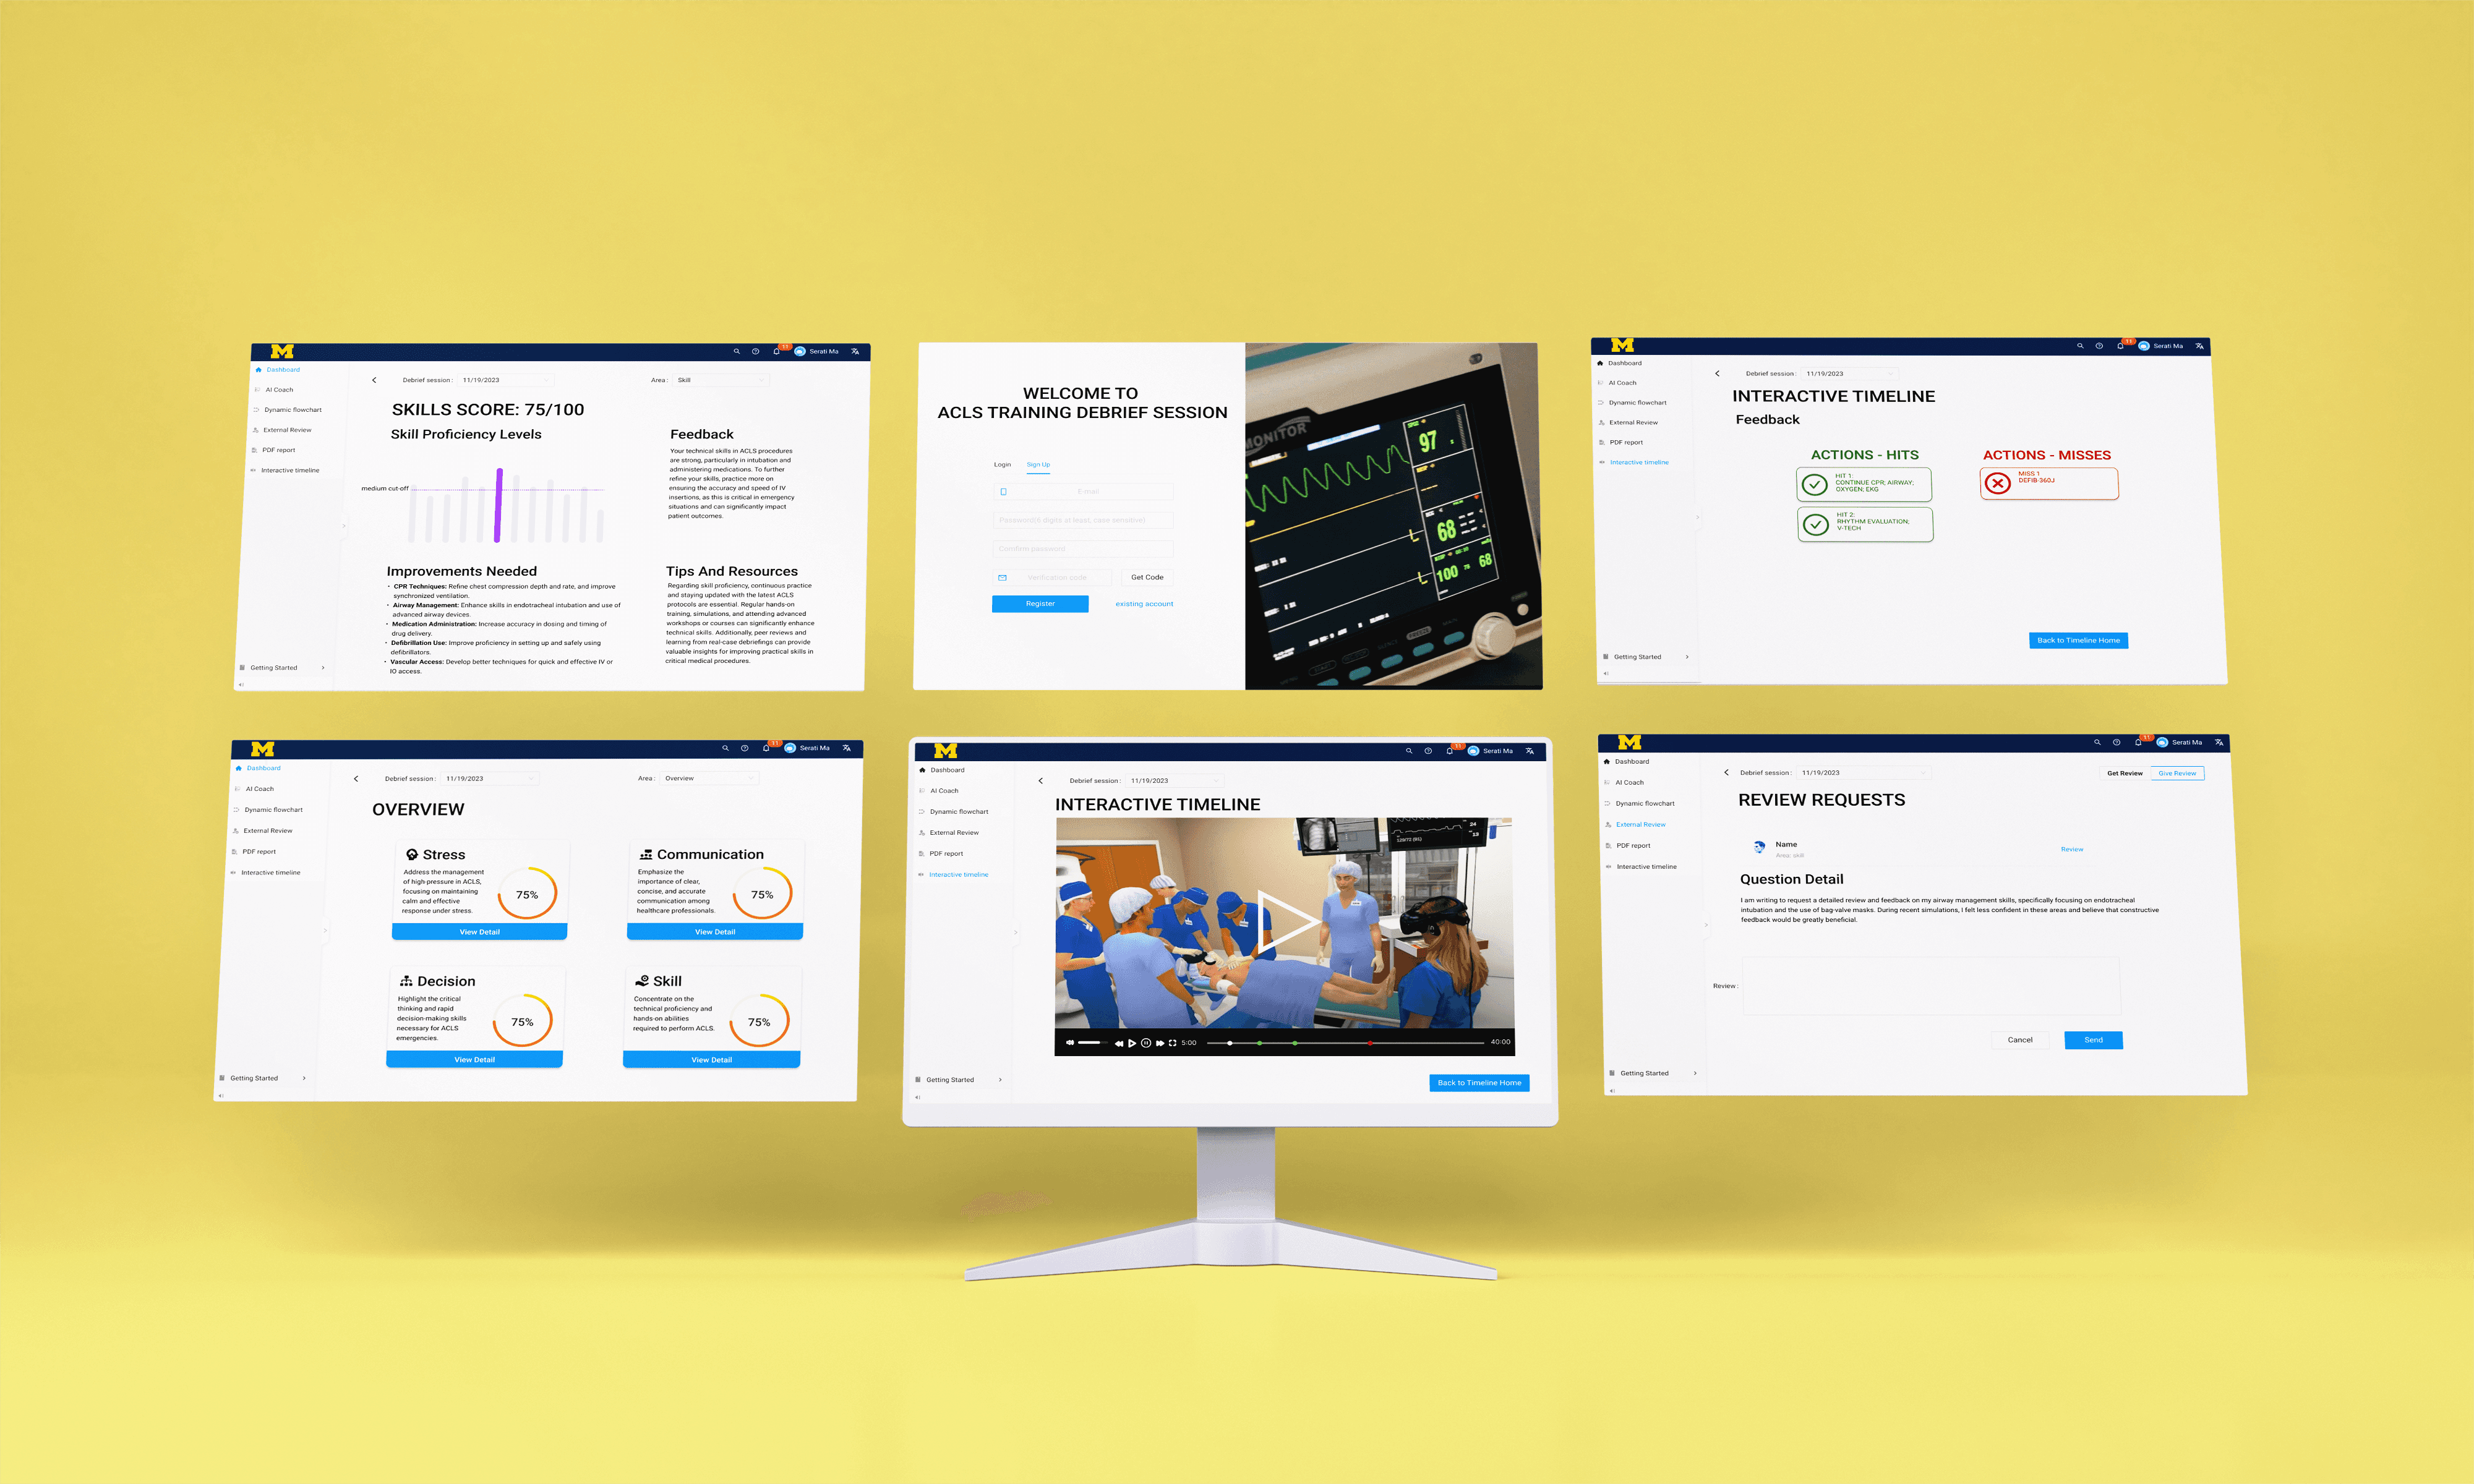
High Fidelity Prototype
Following the user journey mapping, we created story maps to visualize the steps and tasks required for users to achieve their desired outcomes. We developed both a common story map and individual story maps for each user type to capture unique needs and processes.
The story maps effectively highlighted the sequence of activities and tasks necessary for each user to reach their goals. This approach provided a clear and structured view of user interactions, revealing both common and unique pathways to success.
Methodology
Methodology
Incorporation of Feedback
Design Adjustments: Modified the design based on user and accessibility testing insights to address issues and implement recommended changes.
Final Refinements: Improved visual elements, layout, and ensured alignment with user needs and accessibility standards.


SampleENV - April 2023
SampleENV - April 2023
SampleENV - April 2023
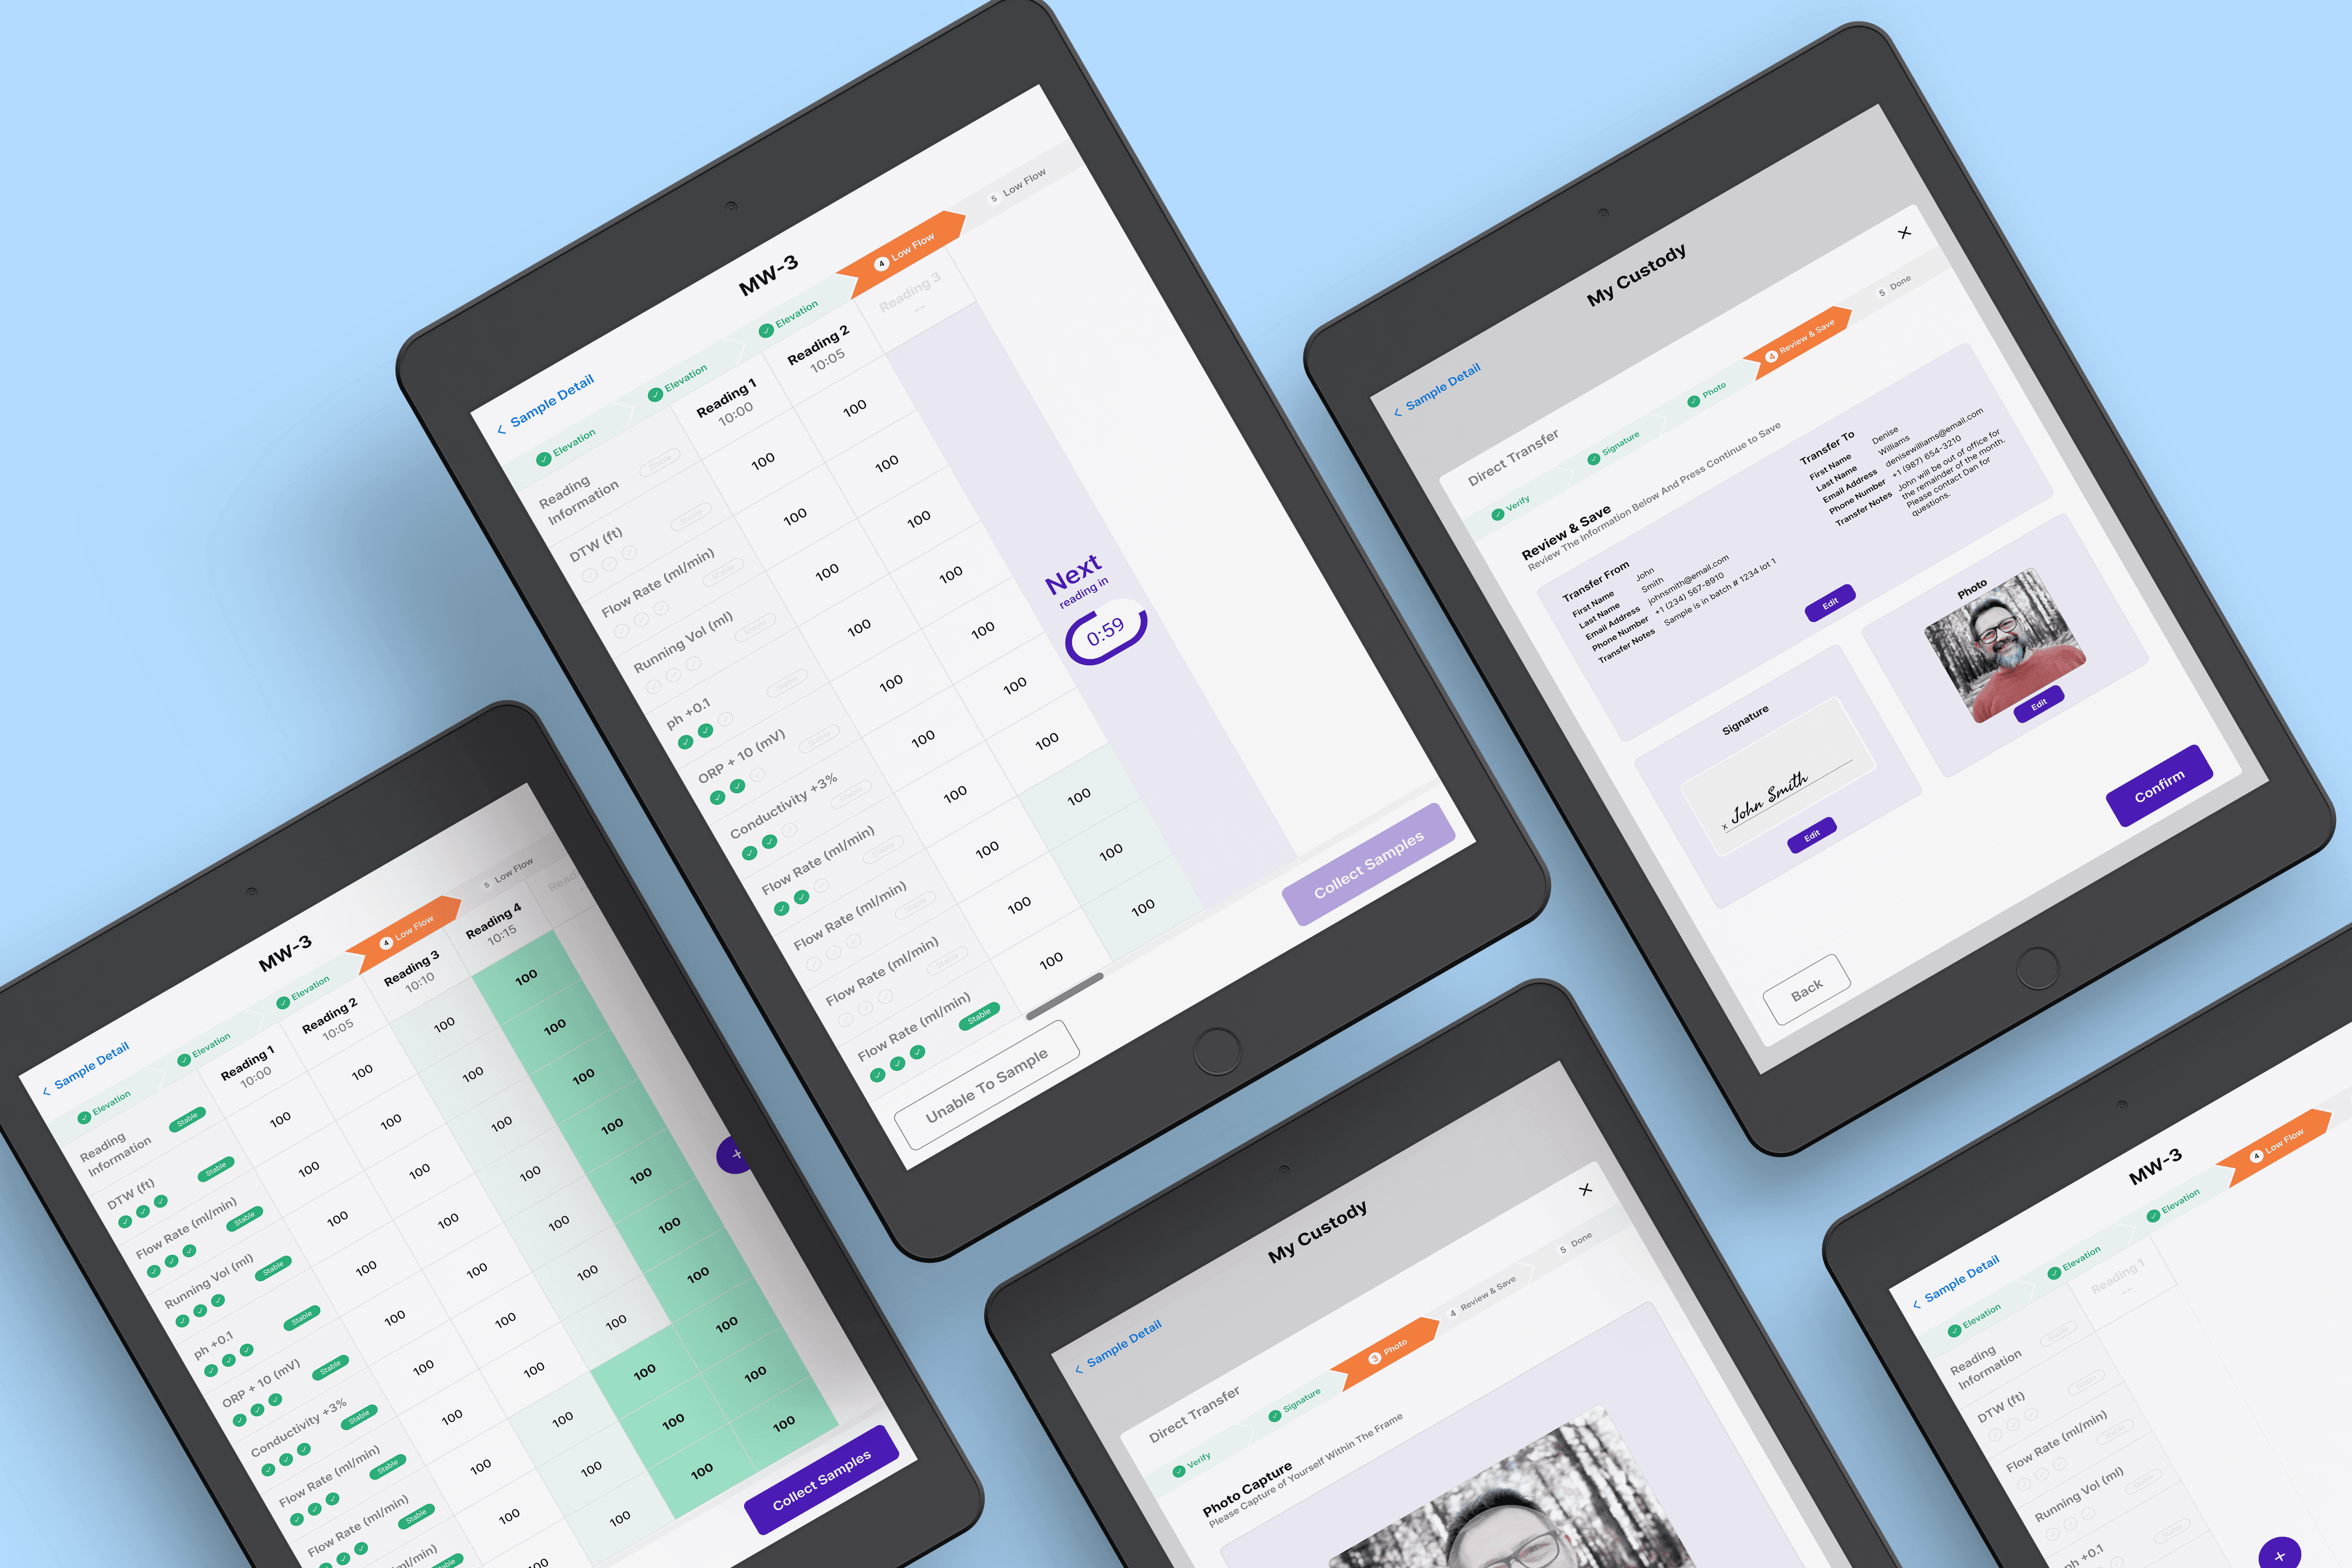
SampleENV
April 2023
View our recommended solutions to the UI for SampleServe's ground water sampling field tech app.
View our recommended solutions to the UI for SampleServe's ground water sampling field tech app.
View our recommended solutions to the UI for SampleServe's ground water sampling field tech app.
View our recommended solutions to the UI for SampleServe's ground water sampling field tech app.
